
Graphs
E N D
Presentation Transcript
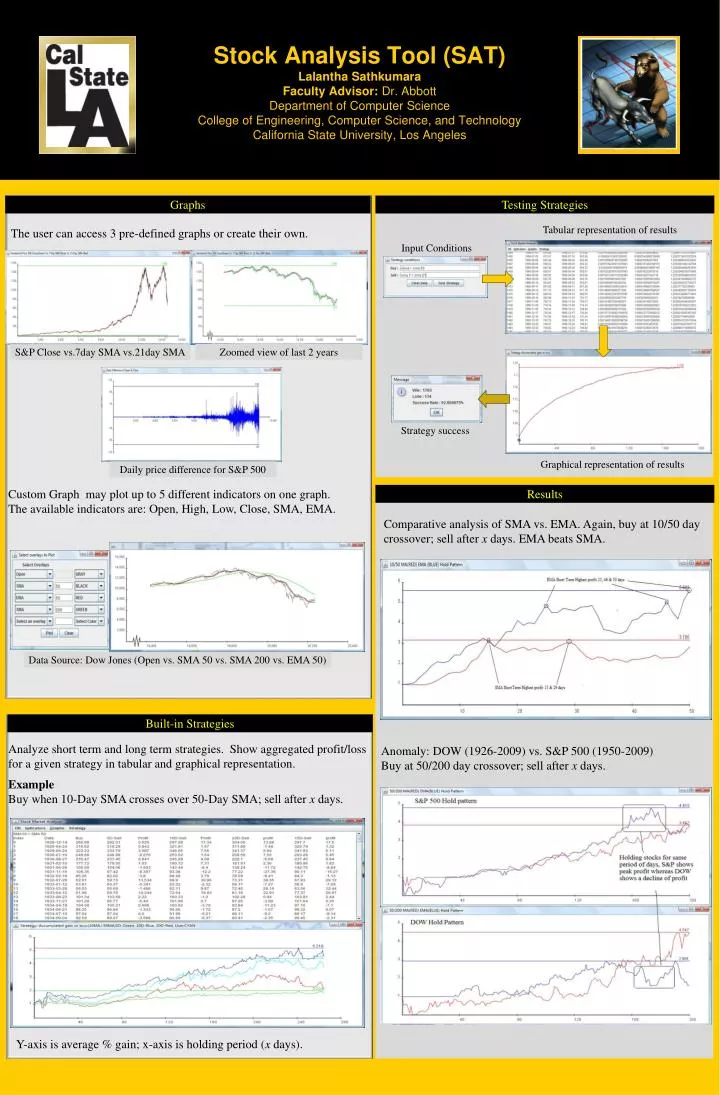
Stock Analysis Tool (SAT)Lalantha SathkumaraFaculty Advisor: Dr. AbbottDepartment of Computer ScienceCollege of Engineering, Computer Science, and TechnologyCalifornia State University, Los Angeles Graphs Testing Strategies Tabular representation of results The user can access 3 pre-defined graphs or create their own. Input Conditions Zoomed view of last 2 years S&P Close vs.7day SMA vs.21day SMA Strategy success Graphical representation of results Daily price difference for S&P 500 Custom Graph may plot up to 5 different indicators on one graph. The available indicators are: Open, High, Low, Close, SMA, EMA. Results Comparative analysis of SMA vs. EMA. Again, buy at 10/50 day crossover; sell after x days. EMA beats SMA. Data Source: Dow Jones (Open vs. SMA 50 vs. SMA 200 vs. EMA 50) Built-in Strategies Analyze short term and long term strategies. Show aggregated profit/loss for a given strategy in tabular and graphical representation. Example Buy when 10-Day SMA crosses over 50-Day SMA; sell after x days. Anomaly: DOW (1926-2009) vs. S&P 500 (1950-2009) Buy at 50/200 day crossover; sell after x days. Y-axis is average % gain; x-axis is holding period (x days).


