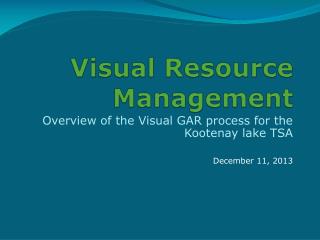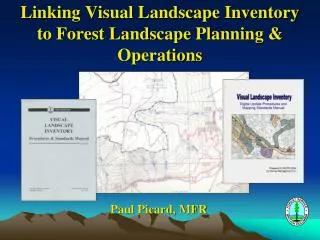
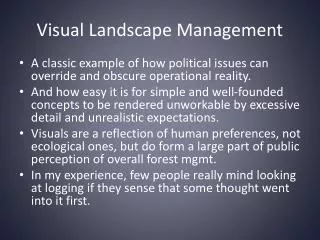
Visual Landscape Management
Visual Landscape Management. A classic example of how political issues can override and obscure operational reality. And how easy it is for simple and well-founded concepts to be rendered unworkable by excessive detail and unrealistic expectations.

Visual Landscape Management
E N D
Presentation Transcript
Visual Landscape Management • A classic example of how political issues can override and obscure operational reality. • And how easy it is for simple and well-founded concepts to be rendered unworkable by excessive detail and unrealistic expectations. • Visuals are a reflection of human preferences, not ecological ones, but do form a large part of public perception of overall forest mgmt. • In my experience, few people really mind looking at logging if they sense that some thought went into it first.
Some local history • 1981 – Forest Landscape Handbook • 1987 – VQO’s for West Arm (P. Bekker) • 1989 – Logging in Kootenay Landscapes: The Public Response. (Berris & Bekker) • 1992 – VQO’s identified for remainder of District (Mirkwood Consultants) • 1993-1999 – Steve Flett modifies some VQO’s • July 1999 – District Manager establishes recommended Visual Quality Classes (VQC’s) • 2010-11 – New Visual Landscape Inventory
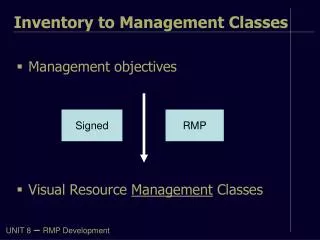
SCENIC AREAS 35% of THLB
Logging in Kootenay Landscapes: The Public Response. 1989 • Mostly what you would expect. People preferred naturally appearing landscapes to those which showed evidence of human activity (like logging, roads, etc). • However, the authors also noted that this preference applied to natural openings that looked like cutblocks, and to cutblocks that looked like natural openings. • People ranked naturally-appearing cutblocks higher in scenic value than natural openings that looked like cutblocks. If they knew that a well-designed opening was a cutblock, this knowledge diminished the scenic value to them.
Fundamental Bias • Many people viewed logging as a negative activity on the land; others just preferred the quality of a “pristine” viewscape (even if it wasn’t). • So, even well-designed logging was going to detract to some degree, especially from locals who would remember that an opening was man-made, even after it had greened up. • A tourist, with no historical reference, was less likely to be offended by a well designed, greened-up cutblock. • And, on well designed cutblocks, visual impacts were short-lived. • Hiding logging made no sense from either an ecological or economic point of view (or even scenic quality over time).
The foundation is laid • So, at this point we planners had some basic tools and concepts that seemed workable. • Licensees had made numerous attempts to address visual quality over the years. Sometimes they worked better than others, but we all learned through doing. • Visuals became a standard input for the Timber Supply Review. Netdown factors were developed, and a shift began towards numerical analysis.
Percent Alteration • For TSR purposes, a limit on percent alteration needed to be developed. • This had to be translated into planimetric from perspective views, which in itself was only a best guess (especially for Partial Retention). • In support of TSR, we looked at past examples of harvesting which met VQO’s and found very little correlation with percent alteration. It was almost entirely a matter of cutblock and road design. • Plus, the size of the visual design unit varied enormously, so for this reason as well, numbers were suspect. • But that’s not to suggest that everybody agreed with us.
Correlation vs. Regression • One of the classic errors in statistical analysis is to assume that correlated variables reflect a cause and effect relationship. • Consider two variables: the rate at which my lawn grows, and the water level in the local reservoir. They are strongly correlated, but neither is the cause of the other. A third variable – rainfall – is the cause of both. • In the case of visual quality, a cause/effect (“regression”) relationship was assumed between percent alteration and public acceptance. I believe this was an error. In my experience, public acceptance comes down to whether an alteration is natural in appearance. Size is virtually irrelevant.
And then... FRPA • You need to understand that Forest Service visual management specialists have had an uphill struggle to keep visuals on the radar of government. • And under FRPA, there was a fear that if you couldn’t measure something, it might not stay as one of government’s objectives. • So, it seemed there was a strong push to somehow “objectify” this subjective value, which may have had the desired effect at the political level, but generated confusion operationally. • There were more public perception studies which focussed on statistical analysis, and considerable division between visual management practitioners on design vs. numbers. This had always been there to some extent; witness the VIA Guidebook.
And the VQO definitions change significantly: preservation: FPPR: consisting of an altered forest landscape in which the alteration, when assessed from a significant public viewpoint, is (i) very small in scale, and (ii) not easily distinguishable from the pre-harvest landscape; FLH, 1981: No activity. VIA, 2001: No visible activities. retention: FPPR: consisting of an altered forest landscape in which the alteration, when assessed from a significant public viewpoint, is (i) difficult to see, (ii) small in scale, and (iii) natural in appearance; FLH, 1981: Activity not visually evident. VIA, 2001: Activities are not visually evident.
partial retention: FPPR: consisting of an altered forest landscape in which the alteration, when assessed from a significant public viewpoint, is (i) easy to see, (ii) small to medium in scale, and (iii) natural and not rectilinear or geometric in shape; FLH, 1981: Activity subordinate in landscape. VIA, 2001: Activities are visible but remain subordinate. modification: FPPR: consisting of an altered forest landscape in which the alteration, when assessed from a significant public viewpoint, (i) is very easy to see, and (ii) is (A) large in scale and natural in its appearance, or (B) small to medium in scale but with some angular characteristics; FLH, 1981: Activity dominates but borrows line and form. VIA, 2001: Activities are visually dominant but have characteristics that appear natural. maximum modification: FPPR: consisting of an altered forest landscape in which the alteration, when assessed from a significant public viewpoint, (i) is very easy to see, (ii) is (A) very large in scale, (B) rectilinear and geometric in shape, or (C) both. FLH, 1981: Activity dominates, may be out of scale. VIA, 2001: Activities are dominant and out of scale, but appear natural in the background.
Public Perception • Remember what we learned back in 1989? That, if people could recognize an alteration as logging, they would rank it lower in scenic value? • This meant there was a basic bias against any pictures where logging could be identified (based on angular block characteristics, brown forest floor, roads, slash, etc), regardless of scenic quality. • To get a true picture of public preferences, you would have to show a carefully selected range of pictures, including greened-up blocks, natural angular openings, etc. Steve Flett and I liked to play this game on our friends as we boated on Kootenay Lake or drove down the highway. “What do you think of that clearcut?” or “How do you like that meadow complex?” Try it. It’s fun. • Note that visually effective green-up (VEG) is not the same as silvicultural green-up. Sometimes, understory vegetation is sufficient to mitigate visual impacts.
The Temporal Element • Most resource values acknowledge the reality of short-term impacts, and that targets cannot be met immediately after harvesting. • Examples include timber harvesting, management of old growth forest, permanent access structures, water quality, reforestation • The assumption has been made (though not stated explicitly, as far as I know) that VQO’s must be met immediately after harvesting. • Prior to understory green-up, this may not be possible because of the “unnatural” or “dead” appearance of a recent opening. • A more logical approach – consistent with how other resources are managed - would be to evaluate 4-5 years after harvesting if assessing in the summer.
Forest and Range Evaluation Program Procedure Each view must be assessed according to whether it meets: the basic visual quality class (VQC) definition (discussed below in section 2.2.3); and (2) the percent perspective landform alteration criteria (discussed below in section 2.3.2), which include consideration of the quality of visual landscape design. • The final Effectiveness Evaluation rating combines the result of the above two independent measures. The achieved VQC under the basic definition is compared with the VQC determined using perspective measurement and adjustment for the scene attributes. The final rating for each landform is determined by reconciling any differences between the two assessments from each viewpoint in a brief written rationale. These assessments are done in isolation; other resource values or issues are not considered. See “DKL_004.pdf” for an example of a FREP effectiveness evaluation
Just want to express some concerns about this particular EE. This was a very difficult and contentious pine block adjacent to the community of Yahk. Primary concerns from residents included domestic water supplies, interface wildfire hazard, creation of new access, and season/duration of operation as well as visual quality. There was an incident with a firearm, and RCMP were involved. While not entirely happy, Yahk residents have since acknowledged that the efforts made by BCTS (and the quick harvesting over winter) probably yielded the best overall result that could have been expected given the circumstances. BCTS made considerable effort, with repeated visual simulations and iterative layout by experienced staff, to design harvesting so as to minimize angles, straight lines, and roads. Community meetings were held which I attended. There is no question that the percent alteration is way up there. And, a fair bit of the residual cover blew down before this assessment was done. However, I do not understand why the assessor gave no credit for design or edge treatments - they are obviously there. And I do not believe that the amount of road and sidecast is excessive compared to other blocks. For that matter, is it appropriate to evaluate VQO's from so close in (0.5 to 1.0 km)? My feeling is that in several years the visual impact will be considerably less and may even be an improvement over the previous stand. I would appreciate it if you would take a look and see what you think. You can appreciate the problems it will cause if licensees make extra efforts and then receive failing grades from an outside party that is not aware of the overall context and issues. FYI - I have been very concerned with the other FREP procedures for stand-level biodiversity and riparian areas. In some instances, they too have indicated failing grades for operations which I considered to be exemplary, given the complex circumstances which licensees were dealing with. For that reason, we have been pursuing the idea of an integrated approach to assessments, which includes the individuals (ie. SP foresters) that had to pull it all together.
Enter the Board • Audit of Visual Resource Management Campbell River Forest District (2005) • Visual Quality of a Chilliwack cutblock (2008)
Predicting visual impacts (FPB 2008. Visual Quality of a Chilliwack Cutblock). Under FRPA, the definition of the visual quality class is the legal requirement. When planning cutblocksunder FRPA, licensees should assess expected results against the applicable visual quality class definition, rather than using the purely mathematical method of basing an assessment on a calculated percent alteration. Percent alteration is merely policy, serving as a predictor tool. Calculations can only predict cutblock impacts in a very general way. Also noted in this report was the failure of the visual simulation to accurately predict the visibility of the resulting harvest
Campbell River Audit The audit results reveal some of the challenges in managing visual resources: • Risk of blowdown appears to be a significant factor in designing cutblocks for visual management. Treatments such as partial cutting and irregular cutblock boundaries are excellent tools for managing visual resources, but are more vulnerable to blowdown, particularly in the exposed coastal region audited. • When planning cutblocks, auditees need to ensure that they assess the expected result against the applicable visual quality class definition, rather than base the assessment on meeting a calculated percent alteration (refer to Key Concepts and Terms). • While auditees generally succeeded in managing landscapes with multiple viewpoints, it is clearly difficult to ensure that a given visual quality objective is always achieved along a visual corridor. This remains a challenge to visual resource management, especially considering the many travel corridors in the audit area. • The visual resource management framework for roadside and other foreground harvesting is not fully developed. A more effective method is required for assessing whether these alterations meet the assigned VQO. In the audit area, the highway corridor lacks a comprehensive strategy for managing the visual resources.
Both drawings have7 percent alteration visible, which is the upper “limit” for partial retention. In this example, the top figure meets a partial retention definition because the openings are small or moderate in scale. The lower figure meets a modification definition because the opening is large in scale and is somewhat angular in shape.
So What’s Needed? • VQO’s may be an inappropriate management tool as presently used. Even resources which can be objectively measured often cannot be given an up-front target in the absence of integrated planning. • Consider terrain stability. A polygon with Very High potential instability requires detailed evaluation, but there is no pre-set management measure. • Measurements such as landscape sensitivity and visual absorption capacity are valid and useful. • If VQO’s are to remain, they should focus on results in the mid-term (5-15 years) and be evaluated so as to minimize the inherent bias against logging. • There are other tools out there (see Blocker 2005).
Example of Visual Design to minimize visual impact of harvesting above Nelson
Visual Simulations • Note: A Visual Impact Assessment does not necessarily require a visual simulation. • If simulations are done, draping the alteration over a photograph seems to be best. • Winter scenes have some significant advantages in terms of evaluating design. • Include overall rationale, resource values, etc in VIA document. Do not use “canned” VIA formats; they can be misleading (ie. place too much emphasis on percent alteration, or contain statements such as “VQO’s must be met from all viewpoints”).