Download
1 / 44
440 likes | 583 Vues
Quantification of Bar Strength and the Structure of Galaxies. Ron Buta University of Alabama. Why study bar properties?. Bars are pervasive among disk galaxies Bars are common to spirals and S0s Bars have been linked to a variety of interesting phenomena :. - circumnuclear starbursts

E N D
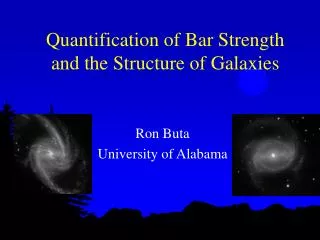
Quantification of Bar Strength and the Structure of Galaxies Ron Buta University of Alabama
Why study bar properties? • Bars are pervasive among disk galaxies • Bars are common to spirals and S0s • Bars have been linked to a variety of interesting phenomena: - circumnuclear starbursts - resonance rings - active galactic nuclei - secular evolution and pseudobulge growth - Bars have cosmological significance
Questions - How frequent are bars in disk galaxies? - What determines bar strength? - To what extent are the features seen in barred galaxies dependent on bar strength? - What is the distribution of bar strengths in disk galaxies? - What does the distribution tell us about galaxy evolution?
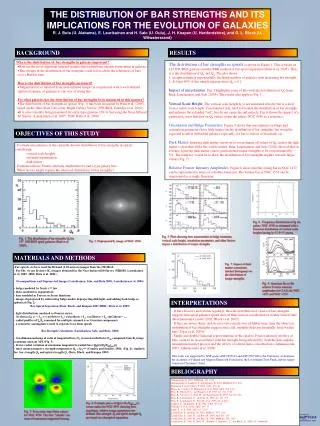
NGC 4340 NGC 4596 NGC 4754 NGC 4608 IC 4290 NGC 1433 NGC 5850 NGC 5921 NGC 1073 NGC 4519 NGC 4027 NGC 4618 The de Vaucouleurs Atlas of Galaxies (Buta, Corwin, & Odewahn 2007): B-band images
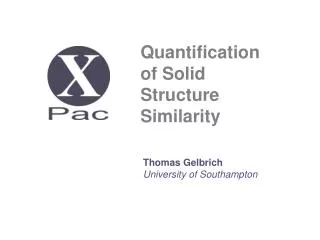
Bar strength as a continuous property NGC 3992 SB NGC 210 SAB IC 1993 SA
Various Samples used to study: - bar strengths in spirals (OSUBGS- Ohio State bright galaxy survey) - bar strengths in S0 galaxies (NIRS0S- near-IR S0 Survey) - Fourier properties of bars in context of Athanassoula models - bulge properties as function of Hubble type
OSUBGS Sample characteristics Buta, Laurikainen, & Salo 2004 OSUBGS consists of typical high luminosity galaxies
Frequency of barred galaxies: visual studies OSUBGS (Eskridge et al. 2000): - H-band - 186 spiral galaxies - 56 % “strongly-barred” - 16 % “weakly-barred” - 27 % “non-barred” Note: Near-IR imaging does not necessarily change the rankings of bars. Optical ---> near-IR SA ------> SAB, SAB -------> SB, SB ------> SB Also see Knapen et al. 2000; Laurikainen et al. 2004; Menendez-Delmestre et al. 2007; Marinova and Jogee 2007
Bar frequency versus redshift: constant to z~1? (Jogee et al. 2004; Elmegreen et al. 2004) Or declining with increasing z: At a lookback time of 7Gyr, about 20% of spiral galaxies “matured” enough to form prominent bars. Most massive galaxies in highest z bin have comparable bar fraction to present day, implying “downsizing” effects. Sheth et al. 2007: Cosmos 2 square degree sample-Bar fraction declines with increasing redshift
What determines bar strength? - in a relatively closed system, depends on effectiveness with which a bar can transfer angular momentum to other galactic components, such as the halo (Athanassoula 2003) - in a relatively open system, external gas accretion and tidal interactions can cause bar growth and destruction (e.g., Bournaud & Combes 2002)
Quantifying bar strength: bar ellipticity Marinova & Jogee 2007 - no evidence for bimodality in bar ellipticities Abraham & Merrifield (2000): Bar ellipticity parameter vs concentration parameter suggest bimodal distribution and rapid evolution between SB and SA, SAB (see Whyte et al. 2002 for refined analysis).
Quantifying bar strength: Relative Fourier Intensity Amplitudes and Bar Contrast A2 SB( r)a <---------------------------------A2 A2 is the maximum of relative Fourier amplitude I2/I0. <------------------------------------- A2 SB0
Athanassoula Bar Models - bar strength determined by transfer of angular momentum to halo - effectiveness depends on halo properties -relative Fourier mass profiles distinguish different halo properties and effects of central mass concentration (CMC) Massive halo with no CMC Massive halo with increasing CMC--------------------------> Athanassoula, Lambert, & Dehnen 2005
Single and double-gaussian Fourier profiles of bars Buta et al. 2005
Quantifying Bar Strength: the Gravitational Torque Method (GTM) - near-IR image - constant M/L ratio---> gravitational potential FT=tangential force F0R=mean radial force Ratio map: Q(i,j)=FT(i,j)/F0R(i,j) QT( r) = |FT( r )/F0R( r )|max Sanders & Tubbs 1980; Combes & Sanders 1981; Quillen Frogel, & Gonzalez 1994; Buta & Block 2001; Laurikainen et al. 2004
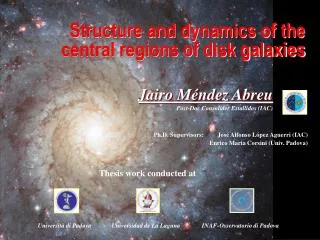
NGC 6951 Ks image FT/F0R Force ratio map
Qg=maximum gravitational torque per unit mass per unit square of circular speed NGC 6951
Bars and the Evolution of Galaxies • Distribution of bar strengths (Sellwood 2000) • buildup of central mass concentration & bar destruction (Pfenniger & Norman 1990; Shen & Sellwood 2004) • bar destruction & reformation via gas accretion (Bournaud & Combes 2002) • bar regeneration and tidal interactions (Berentzen et al. 2004) • pseudobulge and lens formation (Kormendy & Kennicutt 2004)
Das et al. (2007, Ap&SS, submitted). Correlations of bar strength estimates with normalized nuclear velocity dispersion, implying bars weaken as their central components get hotter.
Fourier amplitude A2 correlates with relative radius of m=2 component, implying a bar transfers angular momemtum to other galactic components, and grows stronger and longer relative to disk radius. Luminosity density in inner regions correlates with relative radius of m=2 component, implying galaxies with higher central densities evolve faster. Elmegreen et al. (2007, ApJ 670, L97)
Bar ellipticity parameter (Whyte et al. 2002) vs Qg. Correlations between photometric parameters and type for 216 galaxies Mean Qg vs Hubble type for spirals Laurikainen et al. 2007, MNRAS
Gravitational Torques in Spiral Galaxies • Quantitative dust-penetrated bar classification (Buta & Block 2001) • distribution & type dependence of Qg values for OSUBGS sample (Buta, Laurikainen, & Salo 2004) • active vs nonactive galaxies (Laurikainen, Salo, & Buta 2004) • bar strength and inner ring shape (Buta 2002) • bar/spiral separation and correlations between bar and spiral arm strengths (Buta, Block, & Knapen 2003, Block et al. 2004)
Inner ring shape does not correlate with bar strength R-band with Qg H-alpha with (b/a)ring R-band with Qg H-alpha with (b/a)ring Romero-Gomez et al. (2007) show that invariant manifolds related to periodic orbits around unstable Lagrangian points produce inner ring shapes sensitive to bar strength (mass) but not bar ellipticity.
Grouchy et al. 2008 Star formation rates in rings do not depend much on bar strength or deprojected ring shape. Open circles=SA, filled circles=SB <------------- new result showing deprojected inner ring shapes are also not sensitive to bar strength.
The Distribution of Maximum Relative Bar Torques in Galaxies
Bournaud & Combes 2002 - examined impact of external gas accretion on distribution of bar strengths - competing issues: bar transports gas into center; this builds up central mass concentration, which destroys or weakens bar. Disk heats up and becomes more stable. External gas accretion cools disk, making it susceptible to new bar instability. - distribution of bar strengths tells relative amount of time galaxies spend in different bar states. - examine this observationally for statistically well-defined samples of spirals and S0s.
With external gas accretion, get bar dissolution and reformation Without external gas accretion, get only bar dissolution Bournaud & Combes 2002
Distribution of Qg Values: Spirals _____ observed -------- with gas accretion ……..without gas accretion Qg Block et al. 2002, with preliminary GTM Note extended “tail” in distribution These values are affected by spiral arm torques.
Bar/Spiral SeparationButa, Block, & Knapen 2003 • Use Fourier techniques to separate bars and spirals • plots of Im/I0 versus radius r • symmetry assumption • construction of bar+disk and spiral+disk images
m=2 and 4 relative intensity amplitudes for NGC 6951 in Ks band crosses show “symmetry assumption”
Qb = bar strength Qs = spiral strength Strong bars, weak spirals: Qb ~ Qg Strong spirals, weak bars: Qs ~ Qg NGC 6951
When spiral arm torques are removed, there are more weak bars ------------------->
Bar-spiral separation for various samples suggests that spirals are generally NOT driven by their associated bars. Buta et al. (2008)
Is this a genuine bar-driven spiral? Potential-density phase shift distribution for NGC 986 Ks-band image of NGC 986 showing corotation circle Zhang and Buta 2007
Gravitational Torques in S0-Sa Galaxies • “Near-IR S0 Survey” (NIRS0S, Laurikainen, Buta, Salo, et al.) • Ks band, 2.2 microns • Goal: ~200 S0, S0/a, and Sa in well-defined sample similar to OSUBGS • 2D three-component decompositions
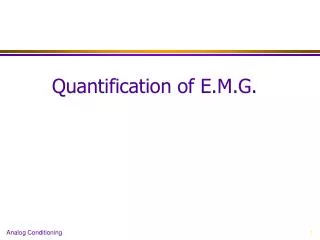
Deprojected Ks-band images NGC 936 NGC 4596 NGC 4608 NGC 4643
Force ratio maps for two early-type barred galaxies NGC 4596 NGC 4643
The distribution of bar strengths in S0 galaxies differs from spirals in lacking an extended “tail” of strongly-barred cases.This is expected if they are not accreting any external gas. Also, S0 bar torques are diluted by significant bulges and larger vertical thicknesses than later type spirals.
Conclusions - GTM is a promising way of quantifying bar strength in galaxies - SA, SAB, SB represent a continuous sequence of increasing bar strength - Qg, Qb, Qs are well-defined parameters - distribution of nonaxisymmetry strengths Qg for spirals favors external gas accretion - distribution of bar strengths for S0s favors no accretion - bars and spirals may be independent features - on average, early Hubble types have weaker bars than late Hubble types. This work was supported by NSF grants AST0205143 and AST 0507140.