Download
1 / 30
300 likes | 499 Vues
Electronic Part Total Cost of Ownership. CALCE, Department of Mechanical Engineering University of Maryland. April 29, 2008. Part Total Ownership Cost. Total Ownership Cost = Purchase price + Part selection + Part approval and adoption costs (including supplier qual)

E N D
Electronic Part Total Cost of Ownership CALCE, Department of Mechanical Engineering University of Maryland April 29, 2008
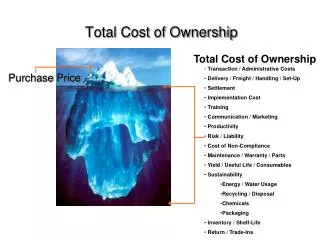
Part Total Ownership Cost Total Ownership Cost = Purchase price + Part selection + Part approval and adoption costs (including supplier qual) + Part qualification (general and/or product specific) + Part- and product- specific NRE costs + Assembly, test and rework (manufacturing) + Cost of failure in the field + Obsolescence and other supply chain problem resolutions The effective total cost of ownership of an electronic part to an organization is usually many times the purchase price of the part
History of this Model • This model is the result of a CALCE Consortium project performed November 2006 – October 2007 • The project was driven by Ericsson (telecom) • Several projects to extend this model have been proposed to start in November 2008
Motivation for this Model • Enabling the estimation of the total cost of ownership for specific parts would influence initial component selection and provide guidance on what actions taken at the component management level provide the maximum payback to an organization • Provide a business case for retiring existing components from databases (in favor of newer components) • Determine the impact of part-specific supply chain disruptions • Determine the value of reusing components in multiple designs
Viewpoint • This model was developed from the part management organization perspective and is designed to enable fundamental part management decisions (as opposed to product management decisions) • Why? • Because the supply chain constraints are part-specific, not product-specific • Product-specific part management decisions are enabled by other tools, e.g., MOCA
Model Overview • The model is actually composed of three different models: • “Maintenance” Cost • Initial approval and adoption • Product-specific approval and adoption • Annual maintenance support • Annual product support • Procurement costs (contract negotiation, purchase order generation, etc.) • Other NRE costs (CAD symbols, etc.) • Manufacturing Cost • Procurement costs (part costs) • Assembly costs • Inspection/test costs • Diagnosis and rework costs • Field Use Cost • Cost of failure • Repairs and spares • Also includes: • Cost of money • Inflation/deflation • Obsolescence resolution • Lifetime buy costs • Inventory costs
Maintenance Cost The maintenance model captures all non-recurring costs associated with selecting, qualifying and purchasing the part (these costs may recur annually, but do not recur for each part instance). = initial part approval and adoption cost = product-specific approval and adoption = annual cost of supporting the part within the organization = all costs associated with production support and part maintenance activities that occur every year that the part is in a manufacturing (assembly) process for one or more products = purchase order generation cost = obsolescence case resolution costs = setup and maintenance for all non-PSL (Preferred Supplier List) part suppliers = non-recurring design-in costs associated with the part d = discount rate on money i = year (starting at year 0) From ABC model ABC = Activity Based Cost
Manufacturing (Assembly) Cost The manufacturing model captures all the recurring costs associated with the part: purchase price, assembly cost (assembly into the system), and recurring functional test/diagnosis/rework costs. = total number of products manufactured in year i = output cost/part from the model shown below = incoming cost/part = purchase price of one instance of the part in year i = assembly cost of one instance of the part in year i Test/diagnosis/rework model used to calculate Cout
Field Use Model The field use model captures the costs of warranty repair and replacement due to product failures associated with the part. = number of failures under warranty in year i f = fraction of failures requiring replacement (as opposed to repair) of the product. Crepair = cost of repair per product instance Creplace = cost of replacing the product per product instance = cost of processing the warranty returns in year i Annual Effective Cost Per Part Site Nj is the number of products manufactured in year j
Part Cost of Ownership Model(Inputs and Outputs) • Inputs: • Data describing the part • A part usage profile (how many products are using the part, how many are used, and when the parts are needed) • Data that describes the selection, manufacturing and support environment for the part • Outputs: • Effective part cost (cumulative and annual) • Effective part cost contributions • Effective part cost allocated to each product
Part Cost of Ownership Model(Part-Specific Inputs) Currency can be selected
Part Cost of Ownership Model(Non-Part-Specific Inputs) Months Warranty length 18 • Inflation/deflation • Cost of money • Lifetime buy parameters • Currency • etc…
Part Cost of Ownership Model(Part Usage Profile Inputs) The user can enter the quantity of products using the part (and the quantities of parts required) Total volume of parts = 12,910,500
Significant decrease in manufacturing volume New products adopting part Lifetime buy End of manufacturing Part Cost of Ownership Model(Example Result) 0 Total cost spent annually (all products using the part) on various aspects of the part’s ownership
Part Cost of Ownership Model(Example Result) 0 Part site = originally manufactured single part location
Part Cost of Ownership Model(Example Result) Effective cost per part purchased after 20 years A $0.015 part has a total cost of ownership of $0.225/part
A Lower Volume Example Same part, but with a total volume of 1290 parts (instead of 12,910,500) 0 A $0.015 part has a total cost of ownership of $712.82/part
Possible Uses of the Model • Compare the effective total ownership cost of parts during part selection • Assess the merits of retiring parts from the part database • Assess the value of reductions in the number of parts supported (optimal size of the preferred parts list) • Assess the impact of part-specific supply chain disruptions • Determine optimal part reuse across multiple products
Reducing the Number of Part Numbers What is the value of a 20% reduction in the number of part numbers supported? For the base case example assuming a 20% reduction in part numbers (12,910,500 volume)
Part Reuse • In the context of this presentation, part reuse means using the same part across many products in the enterprise, i.e., design reuse (not salvage or reuse of used parts) • Why reuse parts? • Fewer PCNs to manage • Consolidation of procurement • Possible reductions in part-specific qualification cost allocated to products • Consolidation of lifetime buys • Promotes reuse of proven design solutions • Improves production line efficiency by reducing diversity • Internal standardization of some part values and sizes (RLCs) PCN = Product Change Notice RLC = Resistors, Inductors, Capacitors
… But The Question Is Is design reuse always a good thing or can you “reuse” yourself out of business? Consider the following scenario: All of your products use (depend on) a common part. An unexpected problem (supply chain disruption) develops with the part. Instead of fighting a fire for one product, you are in trouble on every product simultaneously – you have effectively created a “single point of failure” scenario. This leads one to hypothesize that there is a “volume of use” vs. “breadth of use” tradeoff that is critical in the part reuse decision
Multiple Products Using the Part No problems encountered with the part 1 product Nearly all of the difference is “maintenance cost” – economies of scale 0 20 products
Year 5 Problem Problem resolution commonality 6 product optimum 13 product optimum For the analysis results given here, we have assumed that the cost of the problem resolution in a single product is Cres = $100,000, that we have resources to perform a maximum of one full resolution every 6 months (resolution rate = 0.5 resolutions/quarter), and the cost of unresolved problems is Cunres = $50,000/product/quarter.
Summary • Basic part total ownership cost model completed • The model is starting to be used to explore various part management issues
Proposed Extensions to this Work • The following slides describe proposed CALCE Consortium projects that extend this work
Part Total Ownership Model Extensions(Proposed CALCE P09-S2 Project) • Planned Model Extensions • Multi-Source Models (concurrently used sources) • Phase-out of Parts (prior to obsolescence) • Part Number Reduction Savings • Price versus Volume Relationships • Automation of Sensitivity Analyses • Model Accessibility Enhancements • Documentation development • Training development • Input data refinement and simplification • Default data identification
Organization-Specific Counterfeit Electronic Parts Cost and Risk Assessment(Proposed CALCE P09-S1 Project) • Every pedigree determination or verification action taken costs time and money, and changes the risk associated with getting a counterfeit part • Some pedigrees are more expensive or more risky than others • What is the real value of a pedigree (i.e., return on investment)? This value is source path-, part- and organization- specific Source path A Which (how much) pedigree do you want to pay for? Pedigree 1 Risk of Counterfeit Pedigree 2 Source path B Verification Cost (resources or time)
Incorporate the source-path risk/cost into part total ownership cost estimations or sustainment models. • Map the source-path and elements of the configuration control plan (pedigree) to risk/cost • Construct a model that allows users to customize the (known or suspected) source-path of their parts using pre-defined path elements and assess the risk as a function of source-path details and the costs of employing various levels of pedigree (i.e., tracking, documentation and other verification methods). • Generate graphs like the one on the previous slide
Physics of Failure, Failure Mechanisms and Material Behavior Design for Reliability and Virtual Qualification Strategies for Risk Assessment, Mitigation and Management Life Cycle Risk and Cost Analysis and Management Diagnostic and Prognostic Health Management Accelerated Testing, Screening and Quality Assurance Supply Chain Assessment and Management The CALCE Center for Advanced Life Cycle Engineering Provide a knowledge and resource base to support the development and sustainment of competitive electronic products and systems in a timely manner.