Creating a Weather Station a fourth grade class project
110 likes | 346 Vues
Creating a Weather Station a fourth grade class project. Next. Created by: Tara Vinton Last edited 2/26/04. Standards Objectives Content Assessment References. Table of Contents. Previous. Next. Created by: Tara Vinton Last edited 2/26/04.

Creating a Weather Station a fourth grade class project
E N D
Presentation Transcript
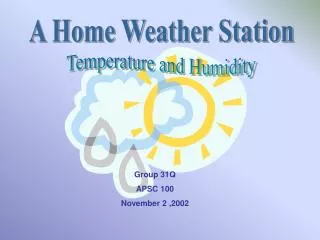
Creating a Weather Stationa fourth grade class project Next Created by: Tara Vinton Last edited 2/26/04
Standards Objectives Content Assessment References Table of Contents Previous Next Created by: Tara Vinton Last edited 2/26/04
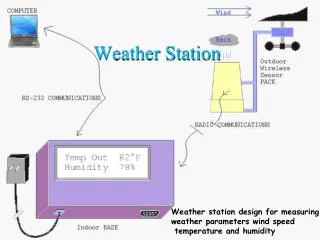
This lesson meets the following Virginia Science Standards of Learning: 4.1 The student will plan and conduct investigations in which (e) appropriate metric measures are used to collect, record, and report data (f) data are displayed using bar graphs (g) numerical data that are contradictory or unusual in experimental results are recognized (h) predictions are made based on data from bar graphs 4.6 The student will investigate and understand how weather conditions and phenomena occur and can be predicted. Key concepts include: (a) weather measurements and meteorological tools (air pressure - barometer, wind speed - anemometer, rainfall – rain gauge, and temperature – thermometer) Standards Created by: Tara Vinton Last edited 2/26/04
Given the necessary directions and materials, students will be able to construct either a barometer, anemometer, or rain gauge. Using the “homemade” barometers, anemometers, and rain gauges, the students will be able to record qualitative weather measurements with “relative” accuracy. Using the newspaper, students will be able to record quantitative measurements about the weather conditions of the day before with one hundred percent accuracy. (students will be recording the daily high and low temperatures, air pressure, wind speed, and rainfall) Using two weeks worth of weather data collected from the newspaper, students will be able to produce bar graphs with ninety percent accuracy. Using the weather information collected from the “homemade” equipment and the weather information collected from the newspaper, students will compare the data and explain at least two reasons for possible discrepancies. Objectives Created by: Tara Vinton Last edited 2/26/04
About the Lesson: This lesson gives students a chance to create their own weather station. The students will learn what barometers, anemometers, and rain gauges measure, as they construct these instruments and collect qualitative weather information from them. The students will also collect daily weather data from the newspaper. The quantitative measurements recorded from the newspaper will expose children to the standard units of weather measurement. This also gives the teacher an opportunity to discuss what real barometers, anemometers, rain gauges and thermometers look like and how they work. After two weeks of collecting the data, students will compare their own weather measurements with those in the newspaper. The students will need to think about why there maybe discrepancies between the measurements. Finally using the weather data from the newspaper, students can construct a total of four bar graphs one for temperature, air pressure, rainfall, and wind speed. On each of these graphs a weather feature is measured on the y-axis and the days are plotted on the x-axis. Once the graphs are completed, the teacher can discuss patterns observed in the graphs and explain how observing these patterns can help meteorologists forecast future weather. Content Created by: Tara Vinton Last edited 2/26/04
Ideas for the lesson: Before the lesson the teacher may brainstorm with the students by asking them to list all the things they know about weather. Then the teacher will look for ways to connect these brainstormed ideas into the lesson. The teacher my want to divide the class into three groups, each group will construct either a barometer, anemometer, or rain gauge. This will save time and confusion. The directions for making barometers, anemometers and rain gauges can be found on the Solution Site web site - click here. Each day the teacher may want only half the class to take readings from their “homemade” instruments while the other half looks in the newspaper. After both groups have collected their information, they can share it with one another. This saves time and promotes positive social interaction. After studying patterns in the bar graphs, the teacher may ask the students to predict the next day’s weather. Students will need to explain why they chose their prediction. The prediction can be evaluated based on the logic of the student’s reasoning. Content Created by: Tara Vinton Last edited 2/26/04
The teacher may assess the students’ work throughout the lesson. At the end of the unit, a quiz may be developed to evaluate the children’s overall understandings. Here are some suggested ideas for the quiz. Each student will be given a copy of the daily weather information as it is reported in the newspaper. Independently, the students will identify the high and low temperature, wind speed, air pressure, and rainfall. (all weather measurements should be identified and labeled with the correct units.) Then the students will be asked to identify the weather instruments used to collect each piece of weather data. (For example: 75o F is a temperature measurement, thermometers are used to measure temperature) Lastly, students may be given several bar graphs presenting weather data collected over a few months. Students will be asked questions which require them to interrupt the information, to identify patterns, and to make logical predictions. Assessment Created by: Tara Vinton Last edited 2/26/04
The concept for this lesson plan was developed based on some of the weather units outlined on the Solution Site web site. Many specific ideas for this lesson were adapted from a lesson plan called Weathering with Your Own Instruments, written by Linda Work, Ruth Potts, and Peggy Grantham and posted on the Solution Site. Other related web sites: Weather Forecasting - an online meteorology guide Web Weather for Kids – website designed for kids to learn about weather References Return to the Table of Contents Previous Created by: Tara Vinton Last edited 2/26/04