Iron Deficiency Anemia
1.59k likes | 5.05k Vues
Iron Deficiency Anemia. Heather Escoto, MD Pediatric Hematology/Oncology Children’ s Center for Cancer and Blood Diseases at St. Vincent . Disclosures. Nothing to disclose. Objectives. Review of the following:

Iron Deficiency Anemia
E N D
Presentation Transcript
Iron Deficiency Anemia Heather Escoto, MD Pediatric Hematology/Oncology Children’s Center for Cancer and Blood Diseases at St. Vincent
Disclosures • Nothing to disclose
Objectives • Review of the following: • The definitions and classifications of anemia and factors affecting hemoglobin levels • The function, mechanisms of absorption, transport, and storage of iron • The incidence, risk factors, and etiology of iron deficiency • Physical exam findings, laboratory values, staging, and differential diagnosis of iron deficiency and iron deficiency anemia • AAP Screening recommendations, prevention, and treatment of iron deficiency • Effects of iron deficiency and iron deficiency anemia
“Anemia 101” • Definition • Classification
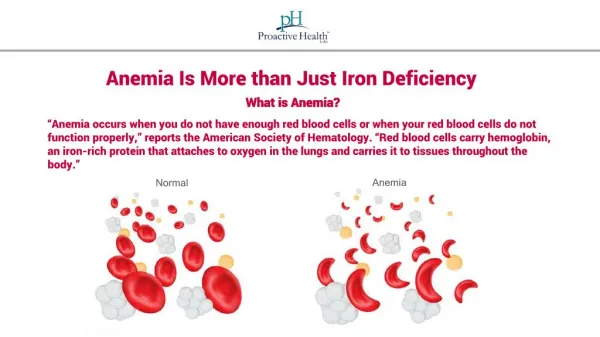
Definitions of Anemia • Physiologic definition: • -Hemoglobin too low to meet oxygenation demands • Laboratory definition: • -Hemoglobin at least 2 standard deviations below mean value based on age, gender, and race • **Laboratory definition of anemia does not always agree with physiologic definition of anemia!
Factors that affect hemoglobin levels • Age • Sex • Race • Puberty • Altitude • Heredity
Hemoglobin levels in infants- the physiologic nadir • Term infant • -nadir- 12 weeks of age • -hemoglobin 9.5 gm/dL at nadir • Premature infant • - nadir- 6-8 weeks of age • -hemoglobin 7.0 gm/dL at nadir • -nadir earlier and lower!!!
Age specific Hemoglobin levels • AgeHgb (g/dL) • 26-30 week 13.4 (11) • 28 week 14.5 • 32 week 15.0 • Term (cord) 16.5 (13.5) • 1-3 day 18.5 (14.5) • 2 week 16.6 (13.4) • 1 month 13.9 (10.7) • 2 month 11.2 (9.4) • 6 month 12.6 (11.1) • 6 mo-2 year 12.0 (10.5) • 2 year-6 year 12.5 (11.5)
Age specific Hemoglobin levels (cont.) • AgeHgb (g/dL) • 2 year- 6 year 12.5 (11.5) • 6 year-12 year 13.5 (11.5) • 12-18 year (male) 14.5 (13) • 12-18 year (female) 14.0 (12)
Hemoglobin differences between African-American and Caucasian children Mean Hgb g/dL Males Females
Sexual Maturity and Hematocrit Daniel et al. Hematocrit: maturity relationship in adolescence. Pediatrics 1973;52:388–394.
Sexual Maturity and Hematocrit Daniel et al. Hematocrit: maturity relationship in adolescence. Pediatrics 1973;52:388–394.
Basic Laboratory Evaluation of Anemia • Complete blood count • Red blood cell indices- MCV, MCHC, RDW • Reticulocyte count • Peripheral smear-red cell morphology • 5. Other labs as clinically indicated- iron studies, electrophoresis, hemolytic workup, Coombs
Reticulocyte count and anemia Reticulocyte
Reticulocyte count-absolute and percentage • Reticulocyte count (percentage)- • - % of absolute concentration of RBCs containing precipitated RNA (reticulin) • -non-invasive measure of new red cell production by bone marrow • -dependent on RBC count • -overestimated with severe anemia • Absolute reticulocyte count • % Reticulocytes X RBC count/100 • Hgb 6.4 - 3% X 2,080,000 /100=ARC 62,400 • Hgb 11.2 - 3% X 3,470,000 /100= ARC 104,100
Physiologic response to anemia • Increased heart rate • Increased stroke volume • Vasodilation • Decreased oxygen affinity (right shift in oxygen-hemoglobin dissociation curve)
Classification of Anemia • Mechanism- • -Decreased production • -Hemolysis • -Blood loss • RBC size- • -Microcytic • -Macrocytic • -Normocytic
Classification of anemia • Mechanism- • Decreased production • -Marrow infiltration-malignancy • -Marrow injury- infections, toxins • -Nutritional deficiency • -Ineffective erythropoesis (thalassemias) • -Erythropoietin deficiency • -Labs: Low reticulocyte count, variable MCV
Classificationof anemia • Blood loss- • -Reticulocyte count usually elevated- bone marrow trying to compensate • -MCV usually normal to slightly elevated • Hemolysis- • -Acquired • -autoimmune process, vessel injury, • -Inherited RBC defect • -Reticulocyte count usually elevated • -MCV normal to slightly elevated
Classification of anemia- morphology • MicrocyticNormocytic • -Iron deficiency -Chronic disease • -Thalassemia -Malignancy • -Chronic disease -Renal failure • -Copper deficiency -Blood loss • Macrocytic-Hemolytic disorders • -Folate deficiency -Hemoglobinopathies • -Vitamin B12 deficiency • -Inherited bone marrow failure • -Hypothyroidism • -Drug induced • -Active hemolysis
Why is iron deficiency important? Remains most common nutrient deficiency in developing countries Over 1 billion people affected, nearly half of the world’s young children Decline in prevalence in industrialized countries- but still common In US, most common in lower income infants and toddlers 12-36 months of age and teenage girls Over 700,000 toddlers affected in the US, 1/3 with anemia, over 7.8 million adolescent females/women Long term effects on neurodevelopment, behavior, neurotransmitter myelination, energy metabolism Increased susceptibility to lead toxicity
Why is Iron important? • -Essential component of hemoglobin and myoglobin • -Component of certain proteins important for respiration and energy metabolism • -Component of enzymes involved in the synthesis of collagen and some neurotransmitters • -Essential for normal immune function
Iron: too much is bad • Generates free radicals • Causes oxidative damage to cells • Protective mechanisms • Intracellular and intravascular iron bound to carrier proteins- transferrin, ferritin, hemoglobin, etc. • Iron absorption tightly regulated • Iron overload- most commonly from chronic transfusions: 1ml PRBCs has 1 mg iron
Iron: How much do we need? • Preterm infants: 2-4 mg/kg/day • Full term infants: 1 mg/kg day • Children 1-3 years old: 7 mg/day • Children 4-8 years old: 10 mg/day • Children 9-13 years old: 8 mg/day • Males 14-18: 11 mg/day • Females 14-18: 15 mg/day
Hemoglobin • 4 globin chains (2 alpha and 2 beta globin chains) • 4 heme molecules with iron in the center Heme molecule Hemoglobin
Ferritin • Intracellular protein that stores and releases iron in a controlled fashion • Aggregates of ferritin form hemosiderin • Ferritin is also an acute phase reactant- acts to protect iron from being used by an infective agent Fe3+ Ferritin Fe 2+ apoferritin
Iron containing enzymes • -Important in oxidative metabolism and DNA synthesis • Heme proteins: • -Cytochromes • -Catalase • -Peroxidase • -Cytochrome oxidase • Flavoproteins: • -Cytochrome C reductase • -Succinic dehydrogenase • -NADH oxidase • -Xanthine oxidase
Iron Balance • Intake= 10 mg/day • Absorption= 1 mg/day- variable • Loss- 1 mg/day- mainly by sloughing of enterocytes (and menstruation in females) • Iron stored in macrophages and hepatocytes
Iron absorption • 10% of dietary iron is absorbed • Absorption depends on: -dietary iron content - bioavailability (heme vs. non- heme) - mucosal cell receptor number • Main absorption occurs in duodenum
Iron absorption • -Heme (meat) >> non-heme iron sources • -(30%-50% vs. <10%) • -Ferrous sulfate >> ferric sulfate • -Enhanced by red meat, ascorbic acid, breast milk • -Diminished by vegetable fiber, cow milk, egg yolk, tea, phytates, phosphates (soda)
Iron absorption • Iron is converted from Fe3+ to Fe2+ by ferrireductase • Fe2+ transported across mucosal surface of enterocyte by DMT1, stored as ferritin • Ferritin releases Fe2+ which is transported across basolateral surface of enterocyte with help of ferroportin ***** • Fe2+ converted back to Fe3+ by Hephaestin • Fe3+ binds to transferrin in plasma
Ferroportin and Hepcidin • Hepcidin • -Blocks ferroportin • -Prevents absorption of iron from enterocytes • -Prevents iron exportation from macrophages • -Increased in inflammation • -Leads to reduced serum iron, microcytic anemia, and incomplete response to iron therapy • Ferroportin • -Transporter protein in enterocytes and macrophages • -Blocked by hepcidin
Iron uptake by the erythroblast • Fe3+ bound to transferrin attaches to transferrin receptor on erythroblast • Transferrin and Fe3+ separate, Fe3+ combines with heme to make hemoglobin • Extra Fe stored as ferritin • Apotransferrin exported out of erythoblast
Fe3+ Iron uptake by the erythroblast Binding of iron-transferrin to its receptor Release of apotransferrin TfR Incorporation into iron-protein Release of iron to storage to storage Ferritin Hemosiderin
Iron deficiency- definitions Iron deficiency (ID)- deficient in iron, no anemia Iron deficiency anemia (IDA)- deficient in iron leading to anemia Anemia- 2 SD below defined “normal” mean based on age and gender
Incidence of ID and IDA in US • Infants • -no national statistics on incidence of ID and IDA in infants before 1 year of age • -Norwegian cohort showed 4% incidence at 6 months increasing to 12% incidence at 12 months • Toddlers (1-3 years) Iron deficiency- 9%-15% Iron deficiency anemia- 3-5% • Children • Iron deficiency- 4% incidence
Incidence of ID and IDA in US adolescents • Adolescent females • Iron deficiency- 9-11% • Iron deficiency anemia- 2-5% • Adolescent males • Iron deficiency < 1%
Prevalence of iron deficiency in US children 1-3 years old • Hispanic- 12% English speaking- 7% • African American- 6% Non-English speaking- 14% • Caucasian- 6% • Overweight-20% Daycare- 5% • Normal weight-7% No daycare- 10% • Bottle fed <12 months -3.8% • Bottle fed >24 months- 12.4%
Risk factors for Iron Deficiency in Infants and Children -Prematurity or low birthweight -Exclusively breastfeeding beyond 4-5 months without iron supplementation -Cows milk before 1 year -Excessive milk intake -Obesity -Poverty/Low socioeconomic status -Malnutrition -Chronic illness or special health needs Brotanek et al. Iron Deficiency in Early Childhood in the United States: Risk Factors and Racial/Ethnic Disparities. Pediatrics 2007;120;568 Pizzaro et al. Iron status with different infant feeding regimens: relevance to screening and prevention of iron deficiency. J Pediatr. 1991 May;118(5):687-92
Risk Factors for iron deficiency in Adolescents • Growth spurts • Heavy menses • Chronic illness • H pylori infection • Endurance training • Vegetarian diets • Obesity • Poverty • Pregnancy
Etiology of Iron Deficiency • Low birth stores • Dietary- not enough intake to meet requirements • Blood loss- majority of iron stored in RBCS • Poor absorption
Newborn Iron Stores • Endowed with 75 mg/kg of iron at birth • Dependent on hemoglobin concentration at birth (majority of iron in circulating RBCs) • Minimally dependent on maternal iron status • Depleted by 3 months in low birth weight infants without supplementation • Depleted by age 5-6 months in term infants • Delayed cord clamping (by 2 minutes) leads to higher ferritin and iron stores at 6 months of age
Dietary iron content • Milkmg Fe/Liter • Breast milk 0.5-1 ** • Whole cow 0.5-1 • Skim 0.5-1 • Formula (low iron) 2- 4 • Formula (high iron) 10-12 • Foodsmg/serving • Infant cereal 6 • Baby foods 0.3-1.2 • **more bioavailable
Iron content of Common Toddler foods/drinks • Foods% daily value/serving • Fruit snacks 0 mg • Chicken nuggets 8% • Macaroni and cheese 10% • Chips 5% • Graham crackers 17% • Cheerios 25% • Goldfish 2% • Drinks% daily value • Apple juice 5% • Pediasure 15% • Soda 0%
Cows milk and iron deficiency • Poor source of iron • Poor absorption (5-10%) • Reduces consumption of other foods, especially with overconsumption • Can cause microscopic GI bleeding