Download
1 / 11
110 likes | 231 Vues
This document discusses the design and performance of front-end electronics for Charge Sensitive Amplifier (CSA) detectors, focusing on the components and configurations that improve sensitivity and noise performance. Key concepts include the use of feedback networks with capacitance (Cf) and resistance (Rf) to optimize signal levels, considerations for detector capacitance and dark current, and methods to improve resolution across a range of energy deposits. Additionally, it examines the implementation of different CSA configurations tailored for varied energy deposition events.

E N D
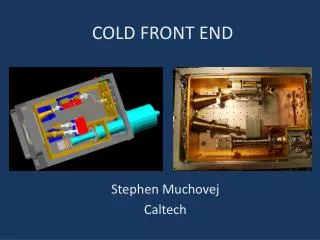
RSH Front End Electronic R. Beaujean, S. Böttcher Kiel Nov 07, 2005
CSA Detector FET + OpAmp shaping amp Feed back Front End Electronic Block Diagramm Feed back network: Cf and Rf (parallel) Cf (pF) defines sensitivity : (44/Cf ) mV/MeV (for Si) Rf (MegOhm) defines time constant of discharging (pile up) shaping amplifier: signal level conditioning for ASIC input improves signal to noise ratio can select fast charge collection
CSA Noise considerations: increasing with: detector capacitance (e.g. 85 pF @ 300 um, 2 cm²) detector dark current ~ SQRT(Id) (doubles every 8 degree K) decreasing with: increasing FET current noise ~ 1/SQRT(gm); gm~SQRT(Id) gm (mutual conductance, forward transfer admittance) is the parameter we can influence by selecting the type of FET and the FET drain current (--> power consumption).
Range of Energy Deposit Measurements in Si The minimum detectable energy deposit must be ~ 60 keV (well below 115 keV of MIPs in 300 um Si) assuming a dynamic range of 10k for the analogue section, this gives an upper limit of 600 MeV energy deposit Maximum output voltage of the CSA is ~3 Volt --> Cf = 44 mV * 600 MeV / 3V = 8.8 pF the CSA output for 60 keV energy deposit is then 0.3 mV
How to improve the resolution for required energy deposit range at given ADC resolution For CsI and BC430M: Photodiode1+ CSA1 with low Cf for lowE events (high gain) Photodiode2+ CSA2 with med. Cf for med.E events (med. gain) Photodiode3+ CSA3 with high Cf for highE events (low gain) For SSD (A, B, C detectors) : only 1 block of SSD-detector + CSA behind the CSA two independent shaping amplifiers with low (x1) and high (x16) gain respectively (the CSA defines the dynamic range).
Components small size, SMD active components required 1. FET: BF862 SOT23-3 plastic package equivalent noise input voltage 0.8 nV/Hz input capacitance 10 pF transfer admittance gm 45 mS typ. 2. OpAmp: AD8005 SOT23-6 plastic package low quiescent current ~ 400 uA low noise, high slew rate, plastic packages have to be qualified for flight
Quiescent Power consumption CSA: FET drain Id~ 4mA @ 3V; amplifier 0.5 mA@ +-5V noise critical FETs may be operated with Id>4 mA, less critical FETs may be operated with Id<4 mA shaping amplifier: 0.5 mA@ +-5V Interface to ASIC positive output signal, shaping time TBD (1-5 us)