Download
1 / 1
10 likes | 105 Vues
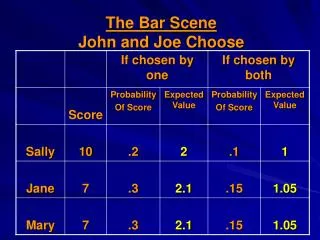
Assess worker productivity using the equation w=f x d to analyze the amount of work done by Joe, John, Ashman, and Bill. Joe - 60 Joules, John - 80 Joules, Bill - 28 Joules, Ashman - 50 Joules. Identify the most efficient worker based on the given work output.

E N D
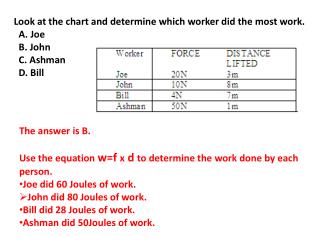
Look at the chart and determine which worker did the most work. A. Joe B. John C. Ashman D. Bill • The answer is B. • Use the equation w=f x d to determine the work done by each person. • Joe did 60 Joules of work. • John did 80 Joules of work. • Bill did 28 Joules of work. • Ashman did 50Joules of work.