Evaluation of Association Analysis Models for Mapping Population
Comparison of GLM-Q, MLM-QK, and MLM-K models for association analysis in a population study, assessing relatedness and kinship using kinship matrix and SSR loci data. The GLM-Q model showed the best fit for the data set.

Evaluation of Association Analysis Models for Mapping Population
E N D
Presentation Transcript
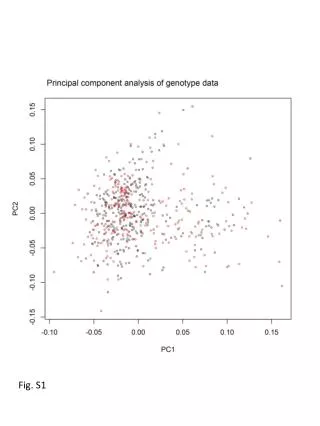
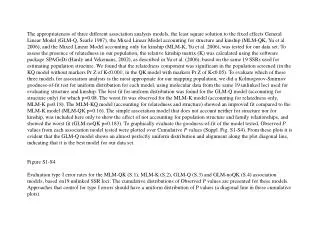
The appropriateness of three different association analysis models, the least square solution to the fixed effects General Linear Model (GLM-Q, Searle 1987), the Mixed Linear Model accounting for structure and kinship (MLM-QK, Yu et al. 2006), and the Mixed Linear Model accounting only for kinship (MLM-K, Yu et al. 2006), was tested for our data set. To assess the presence of relatedness in our population, the relative kinship matrix (K) was calculated using the software package SPAGeDi (Hardy and Vekemans, 2002), as described in Yu et al. (2006), based on the same 19 SSRs used for estimating population structure. We found that the relatedness component was significant in the population screened (in the KQ model without markers Pr Z of K<0.001; in the QK model with markers Pr Z of K<0.05). To evaluate which of these three models for association analysis is the most appropriate for our mapping population, we did a Kolmogorov-Smirnov goodness-of-fit test for uniform distribution for each model, using molecular data from the same 19 unlinked loci used for evaluating structure and kinship. The best fit for uniform distribution was found for the GLM-Q model (accounting for structure only) for which p=0.08. The worst fit was observed for the MLM-K model (accounting for relatedness only, MLM-K p=0.18). The MLM-KQ model (accounting for relatedness and structure) showed an improved fit compared to the MLM-K model (MLM-QK p=0.16). The simple association model that does not account neither for structure nor for kinship, was included here only to show the effect of not accounting for population structure and family relationships, and showed the worst fit (GLM-noQK p=0.183). To graphically evaluate the goodness-of-fit of the model tested, Observed P values from each association model tested were plotted over Cumulative P values (Suppl. Fig. S1-S4). From these plots it is evident that the GLM-Q model shows an almost perfectly uniform distribution and alignment along the plot diagonal line, indicating that it is the best model for our data set. Figure S1-S4 Evaluation type I error rates for the MLM-QK (S.1), MLM-K (S.2), GLM-Q (S.3) and GLM-noQK (S.4) association models, based on19 unlinked SSR loci. The cumulative distributions of Observed P values are presented for these models. Approaches that control for type I errors should have a uniform distribution of P values (a diagonal line in these cumulative plots).
S1. MLM-QK model 1.0 0.9 0.8 0.7 0.6 0.5 Cumulative P 0.4 0.3 0.2 0.1 0.0 0 0.2 0.4 0.6 0.8 1 Observed P
S2. MLM-K model 1.0 0.9 0.8 0.7 0.6 0.5 Cumulative P 0.4 0.3 0.2 0.1 0.0 0 0.2 0.4 0.6 0.8 1 Observed P
S3. GLM-Q model 1.0 0.9 0.8 0.7 0.6 Cumulative P 0.5 0.4 0.3 0.2 0.1 0.0 0 0.2 0.4 0.6 0.8 1 Observed P
S4. GLM-noQK model 1.0 0.9 0.8 0.7 Cumulative P 0.6 0.5 0.4 0.3 0.2 0.1 0.0 0 0.2 0.4 0.6 0.8 1 Observed P
![[S1]](https://cdn2.slideserve.com/4310044/slide1-dt.jpg)