1 / 22

Figure S1: Mathematical model of CD14 signaling pathway

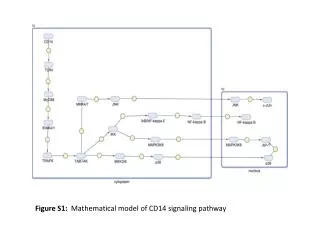
Figure S1: Mathematical model of CD14 signaling pathway. Figure S2: Mathematical model of PI3K signaling pathway. Figure S3: Mathematical model of TNF signaling pathway. Figure S4: Mathematical model of EGF signaling pathway.

uta
Télécharger la présentation

Figure S1: Mathematical model of CD14 signaling pathway

An Image/Link below is provided (as is) to download presentation Download Policy: Content on the Website is provided to you AS IS for your information and personal use and may not be sold / licensed / shared on other websites without getting consent from its author. Content is provided to you AS IS for your information and personal use only. Download presentation by click this link. While downloading, if for some reason you are not able to download a presentation, the publisher may have deleted the file from their server. During download, if you can't get a presentation, the file might be deleted by the publisher.

E N D

Presentation Transcript


  1. Figure S1: Mathematical model of CD14 signaling pathway

  2. Figure S2: Mathematical model of PI3K signaling pathway

  3. Figure S3: Mathematical model of TNF signaling pathway

  4. Figure S4: Mathematical model of EGF signaling pathway

  5. Figure S5: Mathematical model of MAPK signaling network

  6. (B) (A) Figure S6: Simulation graphs of (A) CD14 (B) TLR4

  7. (A) (C) (B) Figure S7: Simulation graphs of (A) cytoplasmic NF-kappa B (B) EGF (C) TNF

  8. Figure S8: Simulation graph of entire MAPK network

  9. (A) (C) (B) Figure S9: Simulation graphs of TRAF-6 crosstalk point in (A) TNF (B) CD14 (C) MAPK network

  10. (B) (A) (D) (C) Figure S10: Simulation graphs of MKK3/6 crosstalk point in (A) TNF (B) CD14 (C) EGF (D) MAPK network

  11. (A) (B) (C) (D) Figure S11: Simulation graphs of MKK4/7 crosstalk point in (A) TNF (B) CD14 (C) EGF (D) MAPK network

  12. (A) (C) (B) Figure S12: Simulation graphs of PIP2 crosstalk point in (A) EGF (B) PI3K (C) MAPK network

  13. Figure S13: Sensitivity plot of CD14

  14. Figure S14: Sensitivity plot of TLR4

  15. Figure S15: Sensitivity plot of IRAK4/1

  16. Figure S16: Sensitivity plot of EGF

  17. Figure S17: Sensitivity plot of TNF

  18. Figure S18: Sensitivity plot of TRAF-6

  19. Figure S19: Sensitivity plot of cytoplasmic NF-kappa B

  20. Table S1: Mean path length, diameter and average paths for individual pathways Table S2: Statistics of the MAPK network

  21. Table S3: Reactions with high flux values in the network

  22. Table S4: Reactions having high sensitivity coefficient (Wi,j) values in the network

More Related