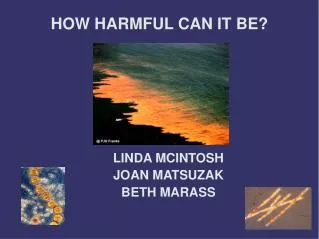
HOW HARMFUL CAN IT BE?
LINDA MCINTOSH JOAN MATSUZAK BETH MARASS. HOW HARMFUL CAN IT BE?. Overview. This series of lessons will Introduce students to the biological economic and regional impact of harmful algal blooms. They will learn about the factors that contribute to the growth patterns of specific

HOW HARMFUL CAN IT BE?
E N D
Presentation Transcript
LINDA MCINTOSH JOAN MATSUZAK BETH MARASS HOW HARMFUL CAN IT BE?
Overview This series of lessons will Introduce students to the biological economic and regional impact of harmful algal blooms. They will learn about the factors that contribute to the growth patterns of specific algae
Key concepts Introduce students to the technology and equipment available to collect biological, physical and chemical data in the oceans. Identify and use real-time oceanographic data to understand phytoplankton blooms. Recognize how organisms are classified and identify target or offending species. Identify the relationship between harmful algal blooms, the effects of biological magnification, and food webs. Explore the consequences of changing conditions on potential bloom sites by collecting and sampling water for causative microorganisms.
Objectives * Recognize that while algal blooms occur locally subject to local conditions, harmful blooms occur throughout the oceans and can have a significant biological and economic impact. * Introduce students to the technology and equipment available to collect biological, physical and chemical data in the oceans. *
* Use historical oceanographic data to understand phytoplankton blooms. * Recognize how organisms are classified and identify target or offending species. * Identify the relationship between harmful algal blooms, the effects of biological magnification, and food webs. * Explore the consequences of changing conditions on potential bloom sites by collecting and sampling water for causative micro-organisms.
Procedure 1Identifying the tools used to collect data Find out how to use satellite and buoy data 1.Visit Buoys and The Global Drifter Program: http://www.aoml.noaa.gov/phod/dac/gdp_information.html 2. Go to Phytopia website or CD to complete the tutorials on Toxic and Harmful Algal Blooms http://www.bigelow.org/hab 3. Create You Own Bloom (available on the CD https://articleworks.cadmus.com/bigelow/index.jsp 4. Visit GoMOOS site and graph monthly average data and analyse results
Procedure 2Bioaccumulation Activity • Students are assigned a specific organism in an Ocean food web • Krill, Fish, Seals and Shark • Their name tag tells them what to do • ex-the krill graze on M & M's for 30 seconds • At the end, students discover the red and orange M & M's are toxic and calculate their % of toxin and if they survive.
Procedure 3Hawaii Field Study • Over the course of an academic year, a secondary level biology class will compare two near-lying coastal sites on the island of O’ahu, Hawai’i, one impacted by anthropogenic disturbances and another in a relatively pristine state, for ciguatoxic elements. • For students living in other parts of the country-they can log onto Wiki and see the data. • Students can make hypothesis and follow along with the Hawaiian study