MiniCal with APDs
This study presents the analysis of the response of Avalanche Photodiodes (APDs) to LED pulser signals during MIP calibration data collection at the CALICE meeting at DESY. Eight normalized LED setups were employed to assess time stability and energy measurements. The results indicate that applying LED corrections significantly improves the time stability of APD responses, reducing variations to approximately ±1.5%. This paper explores the influences of these corrections on energy reconstruction, highlighting that systematic uncertainties are integral to achieving accurate measurements.


MiniCal with APDs
E N D
Presentation Transcript
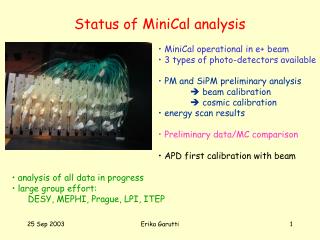
MiniCal with APDs LED corrections and time stability Results from APD analysis with errors J. Zalesak, Calice meeting, DESY
Not read 3 tiles/APD 1 tile/APD PIN diode response to LED pulser • studied during one set of MIP calibration data (typ. < 1h) as LED trigger • 7 runs = 6 scan beam points + core stack scanned 2 times (for reproducibility) 4 masks = 4 LEDs (each 8 APDs + 1 PIN) normalized to average (100%) D B C A core_2 core_1 Time scale • similar behavior, abs. values 100-250 bins • variation +/- 5% (in <1 hour) of LED system J. Zalesak, Calice meeting, DESY
APD response to LED pulser before PIN correction after PIN correction • same behavior as PIN’s • responses are smoother and flatter but still fluctuating after PIN corrections • variation from average is mostly +/- 1.5% (several cells bigger = low response) • time instability of APD response within calibration procedure • can be taken as uncertainty orapply as LED correction to data energy J. Zalesak, Calice meeting, DESY
Influence of LED corrections on energy • Reconstruction of measured energy: • using MIP calibration factors • w/ applying LED corrections linear fit to energy 37.0 X 37.5 MIP/GeV • original MIP calibration (core_1) • + or – MIP calib error added • error on energy +/– 1.0% • new calibration run (core_2) • core_2 w/ LED corrections • applying LED correction lead to consistent results on energy (< 0.5%) J. Zalesak, Calice meeting, DESY
Energymeasurement: linearity only statistical errors applied • systematic error of 1.5% applied: cover syst. uncertainties (calibration method, choice of fit, LED correction, …) • changes of energy fit slope are directly proportionalvariations (errors) of MIP calib. factors (driven by most populated cells in core) • linearity is better then 1%, but fit w/o absolute term changes slope of 4% (additional ADC nonlinearity ? , energy measurement time instability ?, ..?) J. Zalesak, Calice meeting, DESY
Energymeasurement: resolution • systematic errors: • due to noise - dep. on sigma of pedestal • threshold uncertainty - ped separation, 2nd particle • nonlinearity of measurement • results: • stochastic term A = 20.2 ± 0.4 • constant term B = 0 ± 3 • fit is not sensitive to constant term J. Zalesak, Calice meeting, DESY
Consistency among PDs: APD, MAPM, SiPM preliminary preliminary • Linearity: 37.5 x 38.4 x 37.6 MIPs/GeV • Resolution: 20.2 x 21.1 x 20.7 %/sqrt(GeV) • APDs are in agreement with the others PDs at level of 5% (or better) (determination of systematic uncertainties is still in progress) J. Zalesak, Calice meeting, DESY
Conclusion • LED corrections applied to calibration procedure • improve time stability measurement • Systematic uncertainties included in the fits • to linearity and resolution (some has to be still discussed) • APD results are in consistency with others PDs (of 5% level) • (note: measurement setup a bit different) • Analysis is about to go to paper J. Zalesak, Calice meeting, DESY
Back up J. Zalesak, Calice meeting, DESY
Linearity: w/o absolute term J. Zalesak, Calice meeting, DESY
Energymeasurement: resolution (v1) J. Zalesak, Calice meeting, DESY
Energymeasurement: resolution (v2) J. Zalesak, Calice meeting, DESY