Parallel Applications And Tools For Cloud Computing Environments
SALSA PROJECTS http://salsahpc.indiana.edu/. Parallel Applications And Tools For Cloud Computing Environments. Thilina Gunarathne , Stephen Tak-lon Wu, Hui Li , Yuduo Zhou, Bingjing Zhang, Adam Lee Hughes, Saliya Ekanayake , Jong Youl Choi, Seung-Hee Bae , Yang Ruan

Parallel Applications And Tools For Cloud Computing Environments
E N D
Presentation Transcript
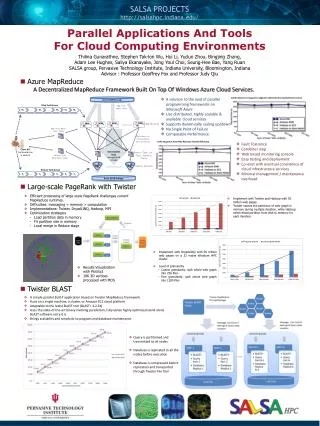
SALSA PROJECTShttp://salsahpc.indiana.edu/ Parallel Applications And Tools For Cloud Computing Environments ThilinaGunarathne, Stephen Tak-lonWu, HuiLi, YuduoZhou, Bingjing Zhang, Adam Lee Hughes, SaliyaEkanayake, Jong Youl Choi, Seung-HeeBae, Yang Ruan SALSA group, Pervasive Technology Institute, Indiana University, Bloomington, Indiana Advisor : Professor Geoffrey Fox and Professor Judy Qiu • Azure MapReduce A Decentralized MapReduce Framework Built On Top Of Windows Azure Cloud Services. • A solution to the void of parallel programming frameworks on Microsoft Azure • Use distributed, highly scalable & available cloud services • Supports dynamically scaling up/down • No Single Point of Failure • Comparable Performance CAP3 Sequence Assembly Absolute Parallel Efficiency Smith Waterman Sequence Alignment All-Pairs Normalized Performance • Fault Tolerance • Combiner step • Web based monitoring console • Easy testing and deployment • Co-exist with eventual consistency of cloud infrastructure services • Minimal management / maintenance overhead • Large-scale PageRank with Twister • Efficient processing of large scale PageRank challenges current MapReduce runtimes. • Difficulties: messaging > memory > computation • Implementations: Twister, DryadLINQ, Hadoop, MPI • Optimization strategies • Load partition data in memory • Fit partition size in memory • Local merge in Reduce stage • Implement with Twister and Hadoop with 50 million web pages. • Twister caches the partitions of web graph in memory during multiple iteration, while Hadoop need reload partition from disk to memory for each iteration. • Implement with DryadLINQ with 50 million web pages on a 32 nodes Windows HPC cluster • Level of granularity • Coarse granularity: split whole web graph into 256 files. • Fine granularity: split whole web graph into 1280 files • Results Visualization with PlotViz3 • 10K 3D vertices processed with MDS • Twister BLAST • A simple parallel BLAST application based on Twister MapReduce framework • Runs on a single machine, a cluster, or Amazon EC2 cloud platform • Adaptable to the latest BLAST tool (BLAST+ 2.2.24) • Uses the state-of-the-art binary invoking parallelism, fully utilize highly optimized stand-alone BLAST software since it is • Brings scalability and simplicity to program and database maintenance. • Query is partitioned and transmitted to all nodes. • Database is replicated to all the nodes before execution • Database is compressed before replication and transported through Twister File Tool
SALSA PROJECTShttp://salsahpc.indiana.edu/ Job Configuration and Submission Tool Microsoft HPC Cluster Submit Compute Nodes Distribute Job Cluster Head-node Sequence Aligning Pairwise Clustering Dimension Scaling PlotViz - 3D Visualization Tool Retrieve Results Write Results Parallel Applications And Tools For Cloud Computing Environments ThilinaGunarathne, Stephen Tak-lonWu, HuiLi, YuduoZhou, Bingjing Zhang, Adam Lee Hughes, SaliyaEkanayake, Jong Youl Choi, Seung-HeeBae, Yang Ruan SALSA group, Pervasive Technology Institute, Indiana University, Bloomington, Indiana Advisor : Professor Geoffrey Fox and Professor Judy Qiu • SALSA Portal and Biosequence Analysis Workflow Pairwise Clustering Cluster Indices The SALSA biosequence workflow consists of a configuration builder and .NET versions of sequence alignment, pairwise clustering, and dimensional scaling software. The results are visualized using PlotViz. Pairwise Alignment & Distance Calculation 3D Plot Alu Sequences Visualization Coordinates Distance Matrix implements Multi-Dimensional Scaling The goal of a biosequence workflow is to automate the process by which scientists analyze large groups of sequences. In this case, sequences are clustered in some meaningful way, and the results are transformed into three-dimensional space for visualization. encapsulates The SALSA Portal presents a set of web services for interacting with HPC resources. One of the Portal’s high-level use cases is an encapsulation of the complete biosequence workflow discussed here. Create Biosequence Analysis Job <<extend>> implements Implementation of the SALSA Portal use cases is accomplished through a set of tiered WCF services. • PlotViz Visualization with parallel MDS/GTM Solvent-screening study This visualizes a result of GTM dimension reduction for 215 solvents used in a pharmaceutical pre-screening process along with 100,000 chemical compounds . The result shows that our tool can clearly separate solvents from other chemicals based on the structural characteristics and users can navigate the large chemical space with visualization. System Architecture of PlotViz • A tool for visualizing data points • Dimension reduction by GTM and MDS • Browse large and high-dimensional data • Use many open (value-added) data • Parallel Visualization Algorithms • GTM (Generative Topographic Mapping) • MDS (Multi-dimensional Scaling) • Interpolation extensions to GTM and MDS CTD data visualization Visualized about 930,000 gene and disease-related chemical compounds in PubChem database by using both MDS (left) and GTM (right) algorithms and labeled as different colors to discover cause-and-effect associations between genes and diseases based on Comparative Toxicogenomics Database (CTD) dataset. Screenshot of PlotViz