Download
1 / 11
110 likes | 129 Vues
We are a purpose-led software company with 33 years of experience and over 700 driven and passionate engineers. PSL partners with its clients from nearshore locations to help them succeed on their most complex software development challenges. We deliver world-class quality software using agile processes and real-time interaction with our clients. Visit: https://www.pslcorp.com/

E N D
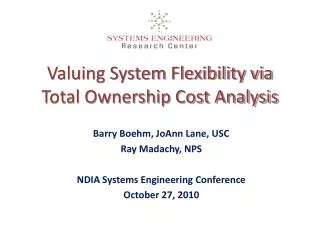
Total Cost of Ownership | Whitepaper What is the value in our price? Understanding how PSL’s value proposition maximizes Total Understanding how PSL’s value proposition maximizes Total Cost of Ownership Cost of Ownership www.pslcorp.com PSL Latin America HQ E-Mail: info@pslcorp.com Web: www.pslcorp.com Phone: 1-866-867-9116
www.pslcorp.com We are compelled to write this White Paper after experiencing the difficulties clients face when comparing vendors with different pricing points. In it, we propose variables that should be taken into account when deciding which vendor is most likely to produce the lowest Total Cost of Ownership for a project. Throughout the paper, we also evidence why we believe PSL is able to offer the lowest Total Cost of Ownership within its peers in Latin America. The term Total Cost of Ownership (TCO) was coined by the Gartner Group in 1987 to help buyers determine both the direct and indirect cost of a System[i]. Within software engineering, the term is understood to include the development, enhancement, maintenance and support costs for an application [ii]. Why is this concept so important? The human mind inherently looks for the “path of least effort” decision. When it comes to pricing, the most immediate information available is “sticker price”. Thus, it is not surprising that many clients vie for the vendor with the lowest rate chart. We argue that “sticker price” is a misleading metric to choose a software services vendor. Unfortunately, other variables that better portray the value of a vendor are hard to convey, as they are often visible only to software practitioners with some experience, who often are forced to relegate a final purchasing decision to less informed financial (or purchasing) managers. As a consequence, organizations often use “hard good” criteria to buy software services (trying to fit a creative, customized software endeavor into a cookie-cutter price versus technical specs mold). We propose that a better way to choose a vendor should consider four key variables that determine, in great part, the Total Cost of Ownership of a software undertaking: Process For any project involving more than one resource, the success of the engineering initiative depends on how well the team works together. Hence, process (or the behaviors, methods and practices that govern the way a group performs) becomes critical for the success of all but the smallest of software initiatives. Productivity In software, perhaps more than in any other engineering endeavor, the productivity between a great developer and a mediocre one may vary by a factor of 10 (some practitioners argue that even more). Salient differences in productivity thus relegate “sticker price” to a variable of secondary importance. Quality Software is expensive to make and is typically built to last. An application that is hastily and shoddily coded will incur a technical debt[1] whose correction can very easily surpass, over the life of the application, the initial cost of building the application in the first place. Risk Software has empirically demonstrated a significantly higher failure rate than other engineering endeavors. It has also been demonstrated how the risk of project failure decreases as the objective quality of the vendor increases. Hence, it might be cheaper to pay a “quality premium” to reduce risk, than to incur a lower upfront cost that entails a higher risk of failure. Cost (as a total, and per unit of time) Taken at face value, cost is simply a price paid per unit of time (i.e. cost per hour or cost per developer per month). From the point of view of TCO, cost should take a long term perspective, and be throughout the life of the application. to making a accounted for Page | 2
www.pslcorp.com PSL is Latin America’s most experienced company in maintaining recognized mature process (we have been assessed continuously at the highest level of CMMi 5 for over eleven years). We are very serious and disciplined about “process” and value it for the results it delivers to clients. Indeed, we emphasize two aspects that make us a truly process-oriented company: 1) Even under an environment where 85% or more of our projects are SCRUM based, we maintain quantifiable hard facts about our engineering process. Because we believe that that which cannot be measured, cannot be improved, we retain company baselines on our productivity and quality at both an aggregate (company level) and granular level (per team member). 2) We are objectively replicable. By this we mean that we have a high level of certainty that our performance in the past is a good prognostic of what we are capable to deliver in the future. On the contrary, organizations without structured processes tend to proceed haphazardly, almost by “luck”. Often such organizations depend on “heroics” (late nights, an extremely talented individual) to produce results, and are prone to become “one hit wonders” that are not able to predictably replicate their wins. PSL is thus a system dependent company, meaning that we are able to replicate our good results in different types of initiatives, without becoming unduly dependent on individuals to drive success. Exploring the variables that impact TCO To measure the impact of the above variables, throughout this paper we appeal to the numerous studies of Caper Jones, Chief Scientist Emeritus at Software Productivity Research (SPR) and perhaps the most renowned software productivity expert in the world [iii]. Professor Jones has recently examined the productivity of over 13,500 software projects undertaken in more than 650 companies within the US [2], giving his insights a solid base. a formally Process Process is perhaps the highest level variable impacting TCO. It is so important that Jeff Sutherland, the inventor of SCRUM, has asserted how a well implemented agile process can lift the productivity of a software development group by a factor of four in terms of throughput [iv]. Broadly defined, a software engineering process describes the methods, activities, and techniques utilized to deploy and manage and engineering describes as well the cultural, social and behavioral rules that are directly or tacitly enforced during said project. A good software engineering process impacts other TCO variables because it: a) produces quality software, b) instills a high level of commitment in the team, and c) significantly diminishes the risk of failure; and hence 4) lowers the overall cost of a software engineering initiative vis-à-vis a haphazard development environment. project. It Page | 3
www.pslcorp.com How is this relevant to TCO? Obviously a process is not inherently good or bad, just predictable (bad processes produce bad results, good ones good results). However, without the discipline of process a Client is left wholly in the dark about what to expect form a vendor. Hiring an unpredictable vendor is like playing Russian roulette. A bad draw can cost a company the budget for the project (we elaborate on this topic when touching upon the concept of risk below). Culture is a fundamental ingredient of process. A company culture determines the attitudes people take with respect to challenges, openness of communication, sharing of information, process discipline and dedication to a task. Without a solid culture, it is impossible to have a solid process. At PSL, we hire engineers as much for their technical ability as for their cultural fit with our organization. Day to day, we seek people who are: curious, open to feedback, open to sharing their knowledge with others, flexible and creative in their thinking. We also foster a culture that raises red flags early, understands that failures are a lesson, and knows that excellence is a path that requires effort, never a destination. On the other side of the coin, studies reflect how companies with higher levels of process performance produce code with significantly more quality. In the comparison chart below (also from Caper Jones), CMMi level 5 companies inject approximately three times less bugs than organizations that, although still “mature” have not yet reached process excellence (i.e. those qualified as CMMi 3)[3],[vi]. Quality Poor code is fast to write. However, it often does not comply with standards, nor respects best technical practices. “Initial” development costs for an application that is hastily but shoddily written are lower. Yet, technical debt is incurred and, come the time for the deployment and maintenance of the application, its Total Cost of Ownership increases dramatically. Below is Caper Jones’ understanding summarized in a graph[v]: of this reality, Page | 4
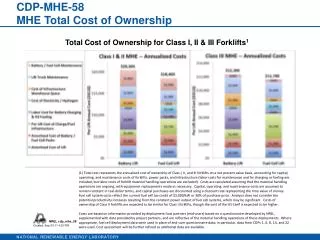
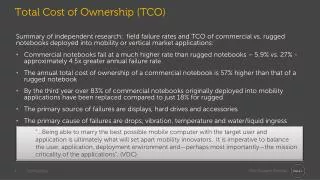
www.pslcorp.com Risk Studies point to an extremely significant risk of failure in software undertakings. The famous Standish Group CHAOS Report, for example, reviews over 8,000 software engineering projects every two years. The 2010 study determined how: close to 42% of software engineering projects where considered challenged; 21% were considered failed; and only 37% were claimed to be successful. Many factors, of course, impact project risk. However, an organization with a strong technical background importantly—a strong software engineering process greatly diminishes the chance of failure for a project. Caper Jones supports this conclusion in the chart below[vii], ascribing a significantly lower level of risk to dealing with a CMMi level 5 engineering company (20 times lower than that of dealing with a CMMi 1 corporation, or close to 6 times lower than dealing with a mature CMMi level 3 vendor). PSL currently performs at world-class quality levels, injecting less than 1 defect per Function Point, on average[1], which would place it at a level at or above what Caper Jones considers to be “best in class” for CMMi level 5 organizations. engineering Now, the incremental cost of letting a bug “survive” in the code as the project life-cycle reaches its end, has been studied at length: that bugs detected after an application has been put into production are 10 to 20 times more expensive to fix than those detected during the early stages of project (not to mention the collateral damage caused by a buggy application in the client’s hands). In an average application (1,000 Function Points) setting up a test environment to fix a bug, finding the bug and running final tests consumes upwards of 12 hours per bug. Multiply the number of defects by the estimated cost to fix them, and one finds a very significant burden for TCO bottom line. and –most For example: ·In a 1,000 FP project (approximately 23,500 effective LOC of Java code) one can expect a serious, committed and established software engineering organization (represented in the CMMi scale as a CMMi level 3) to display 118 bugs once the app is in production. ·Correcting those bugs at a blended rate of US $ 37 dollars per hour takes approximately 1,410 hours, and thus costs approximately US $ 52,000 dollars. Under the same scenario, expected Field Error Rates at PSL would expect the appearance of only 8 bugs once the app is in production, which at US $ 37 dollars an hour would require 99 hours to fix, for a total cost of US $ 3,663 –a cost that is 17 times less! ·Obviously, the larger the application or set of applications deployed within a nearshoring relationship, the larger the savings one perceives from best-in-class quality. Page | 5
www.pslcorp.com One variable often not taken into account when calculation project risk under a nearshoring relationship is Churn Rate (or employee rotation per year). Chun rate in the outsourcing industry can reach levels of 20 to 30% per year, requiring expensive team re-education and causing project delays. PSL’s current churn rate is best-in-class, reaching an average for the last three years of less than 6% per year. PSL is one of the world’s most experienced companies in deploying software engineering processes at the highest maturity levels. In 2002, we became Latin America’s first CMMi level 5 company (and the eight in the world to achieve such recognition). PSL has remained at the highest level of this quality model since then. Risk mitigation is the result of correct execution on many fronts; one of the most important ones being early risk identification (so that corrective action may be taken before it is too late). Transparency is critical for risk to be perceived, and it is a variable in which PSL excels. As a company, our policy is to provide our clients with full and unrestricted, real time access to all project repositories. Furthermore, we monitor (at least weekly) and maintain a record of key productivity and quality variables during our engagements. We are thus ready to take corrective action as soon as a problem buds up, preventing risk to carry-forward and gain momentum. Now, having a strong and disciplined engineering process alone is not sufficient to mitigate risk; one has to have the right process in place. In this regard, PSL chooses SCRUM as its methodology of choice. We are convinced SCRUM provides the agility, flexibility and team commitment (client and vendor) required to minimize project risk. PSL is an expert in SCRUM, leading Latin America’s implementation methodology since 2006. In fact, our company’s SCRUM mentors are chosen from the best of the best, including the renowned Mitch Lacey from the US (SCRUM coach to Microsoft, Yahoo, and Motorola). There are many ways to calculate the positive economic impact risk mitigation has on Total Cost of Ownership (or the extreme negative impact of its correlate, risk materialization). Although the economic cost of risk is specific to each project, we believe there is significant value in working with PSL: a vendor that, in 30 years, has never had an aborted project or a troubled initiative where the client has resorted to legal action to recoup a lost investment. This fact, although not initially reflected in the “sticker price” of a rate per hour, undoubtedly diminishes the expected Total Cost of Ownership of a solution or project undertaken with PSL. Productivity Common technical definitions of productivity consider person-hours as an input, and either SLOC[4](Source Lines of Code) or Function Points as an output (a Function Point represents a normalized measure of software effort[5], or a unit of measure for software effort that separates software “size” from coding language). Total Cost of Ownership depends on productivity on manner. Here example: Team A produces 2 units per hour, while team B produces 1 unit per hour. Team A charges $ 2 per hour, while Team B charges $ 1.20 per hour. Here, Team A is 66% more expensive than Team of the a is straightforward a simplified Page | 6
www.pslcorp.com B. However, because Team A is significantly more productive, so long as it charges less than twice what Team B charges, one is better off working with Team A. Clear enough, but how to measure this in the real world? Luckily, Caper Jones has investigated this issue in depth. Recent productivity statistics from Prof. Jones, stated in Function Points, are as follows (they are taken from over 13,500 software projects in over 600 corporations of all sizes within the US)[viii]. Notice that the smaller the application, the higher the productivity per staff per month (which points to how hard it is to maintain high productivities applications): by quality. We do not release code that is hard to maintain, that does not respect internal coding standards, or that is insecure. In fact, our net productivity metrics (discussed below) are inclusive of processes that filter for such type of code. Going back to Caper Jone’s statistics, the following chart establishes productivity ranges for different types of applications: typical in enterprise-class Within the previous context: PSL’s average productivity under agile projects is of 40 to 60 Function Points per Developer per Month. This means PSL is able to reach and exceed “maximum productivity levels”, as defined by Caper Jones in the studies quoted above. Our above-par productivity is one of the key factors at establishing PSL’s ability to provide an exceptionally competitive Total Cost of Ownership for its clients. Unfortunately, companies have the discipline or process to measure their actual productivity, reason for which statistics often turn mute. PSL is one of those scarce few that does monitor productivity [6]. It is important to note that productivity statistics are tricky and can easily be misleading. Producing many Function Points of trashy and insecure code might be fast, but certainly does not lead to a low TCO. At PSL, our productivity is bounded comparatively very few Page | 7
www.pslcorp.com Cost At this point, we hope to have conveyed the message that the final cost of a software endeavor –its Total Cost of Ownership—is very much dependent on variables that go significantly beyond “sticker price”. Via short but telling examples, we have underscored how process, quality, risk (mitigation) and productivityall directly impact TCO. With this in mind, let’s revisit Caper Jones and his statistics for Cost per Function Point within the United States: A PSL developer works roughly 160 hours per month. At a blended rate of US $ 37 per month, we get a monthly cost of US $ 5,920 for the “blended resource”. At a PSL productivity rate of 50 Function Points per month (our lower bound), we would get a cost per Function Point of $ 118.4 dollars per Function Point ($5,920 / 50 = $ 118.40). To make this comparable to US cost structures (and thus be able to us the above table as a reference), we multiply $ 118.40 x 2, giving us a US-cost-equivalent of the PSL cost per FP of US $ 236.80 dollars. Now we can compare to Jones’ table: US $ 236.80 is significantly lower (47% lower) than Caper Jone’s lowest cost per FP of US $ 500, which is achieved when developing end-user applications. This difference is even larger when we consider that PSL’s statistic is achieved in the development of Web Applications, whose cost per FP (in Jones’ table) is of $ 800. Please note that the Function Point metric described here takes into account a cost per unit of effort – hence, it reveals the true value of a vendor’s services. Thus, it’s a much better insight at value than “sticker price alone” (which does not take into account productivity). The number of interest here is “Fully Burdened Function Points”, which include not only salary pay, but also basic infrastructure required for an engineer to perform his or her job. Now, how does PSL stack against these figures? According benchmarks, a (low) cost developer in the US can be hired directly for a fully burdened blended rate of US $ 75 per hour. PSL’s blended rate to the client (which by definition is fully burdened) is close to US $ 37 per hour, our roughly half of the US rate. How does PSL stack up, then, in the Cost per Function Point scenario: Conclusion It is not uncommon that clients, when seeking nearshore vendors, begin the conversation by asking “What are your rates?”. We like to delay answering this question not because it is not a valid inquire, but because it may close doors early in the conversation that might otherwise lead the client to delve deeper into the value we provide. As Latin America’s implementation of software engineering best-practices, PSL’s strategy has diverged from providing the price”. Quite the contrary, we have built our company on the promise of achieving the to our internal leader in the lowest “sticker Page | 8
www.pslcorp.com lowest Total Cost of Ownershipfor our clients, understood as that mix of process, risk management, quality and productivity that will produce the lowest cost throughout the life of a given software initiative, all things considered. In an alternate world, PSL could offer a very low sticker price by hiring less talented or less experienced developers, lowering its English threshold, allowing developers to work without a disciplined agile process, letting them code without standards, or deploying our services without a stringent quality control. Although this is the path taken by many of our competitors, we would never do this. This would betray our deepest technical convictions of what value means for our clients. We have been in business for over 30 years and know such a strategy would produce short term gains (if at all) in exchange for long term pain; it would foster no long-term relationships, no repurchase from our clients, and no pride of a job well done in our development groups –in short, working to offer the “lowest sticker price” would inevitably lead to failure. For this reason, we stick to our guns, ensuring we remain a world class software organization that provides the lowest possible TCO from Latin America to the world. We invite you to sample our services and see for yourself. Page | 9
www.pslcorp.com [i]http://www.gartner.com/it-glossary/total- cost-of-ownership-tco/ [ii]As defined by Caper Jones in “Software Quality in 2012: A Survey of the State of the Art”. [iii]http://www.amazon.com/Capers- Jones/e/B000APTHHW [iv]http://leanmagazine.net/scrum/scrum- large-projects/ [v]As pictured in “Software Quality in 2012: A Survey of the State of the Art” by Caper Jones. [vi]http://semat.org/wp- content/uploads/2012/10/Capers_Jones.pdf [vii]http://semat.org/wp- content/uploads/2012/10/Capers_Jones.pdf [viii]http://tinyurl.com/k2oqlk7 [1] Technical Debt, a term coined by Ward and Cunningham in 1992, is the assertion that quick and careless development that exhibits low quality levels, results in many years of expensive maintenance and enhancements in the future. [2] Including 150 Fortune 500 organizations, 35 government / military groups, more than 7 large universities, as well as several hundred medium or small organizations within the United States. [3] Also noteworthy is the terrible performance of the so-called CMMi 1 organizations (labeled as “malpractice” in the chart, but also commonly labeled “immature or chaotic”). [4] Effective Lines of Code (ELOC) removes spaces, comments and other lines which do not reflect the computer logic of the application itself. [5] A Function Point is a unit of measure that expresses the amount of business functionality that is present in an information system, regardless of the language the software is written in. [6] In their day to day, developers at PSL log their hours and activities. Automatically, we crawl the code to take account of ELOC. We use these inputs to arrive at our productivity metrics for each developer, throughout the project. The effort involves a simple step and is painless for developers, in no way being cumbersome or deleterious to their speed in programming. Page | 10
www.pslcorp.com /PSLcorp /PSLLatam @PSLcorp @PSLcorp +PSLLatam PSL - Software PSL Latin America HQ E-Mail: info@pslcorp.com Web: www.pslcorp.com Phone: 1-866-867-9116