Reward-Based Free-Choice Task Analysis and Neuronal Activity in Monkeys
70 likes | 188 Vues
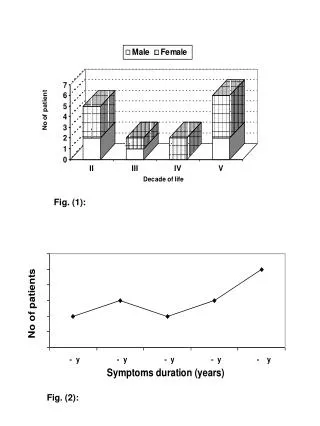
This study explores reward-based free-choice tasks in monkeys, highlighting their performance and decision-making based on large-reward probabilities. The paper includes detailed event timelines, neuronal discharge rates in the striatum, and multiple regression analyses of action values. Key findings illustrate correlations between neuronal activity and reward coding, showcasing various types of reward-value neurons. These insights contribute to the understanding of how primates process rewards and make choices. The data provides crucial evidence for models of choice behavior and reinforcement learning.

Reward-Based Free-Choice Task Analysis and Neuronal Activity in Monkeys
E N D
Presentation Transcript
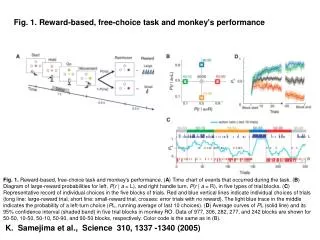
Fig. 1. Reward-based, free-choice task and monkey's performance Fig. 1. Reward-based, free-choice task and monkey's performance. (A) Time chart of events that occurred during the task. (B) Diagram of large-reward probabilities for left, P(r | a = L), and right handle turn, P(r | a = R), in five types of trial blocks. (C) Representative record of individual choices in the five blocks of trials. Red and blue vertical lines indicate individual choices of trials (long line: large-reward trial, short line: small-reward trial, crosses: error trials with no reward). The light blue trace in the middle indicates the probability of a left-turn choice (PL, running average of last 10 choices). (D) Average curves of PL (solid line) and its 95% confidence interval (shaded band) in five trial blocks in monkey RO. Data of 977, 306, 282, 277, and 242 blocks are shown for 50-50, 10-50, 50-10, 50-90, and 90-50 blocks, respectively. Color code is the same as in (B). K. Samejima et al., Science 310, 1337 -1340 (2005)
Fig. 2. Three representative reward-value coding neurons in the striatum K. Samejima et al., Science 310, 1337 -1340 (2005) Fig. 2. Three representative reward-value coding neurons in the striatum. (A) A left–action value (QL-type) neuron in the anterior striatum. Average discharge rates during 10-50 and 90-50 blocks (left panel) and during 50-10 and 50-90 blocks (right panel) are shown. (B) Three-dimensional bar graph of average magnitudes and standard deviation of activity during delay period [shaded period in (A)]. Floor gradient shows the regression surface of neuronal activity by large-reward probability after left and right turns. (C and D) A right–action value (QR-type) neuron in anterior putamen. (E and F) A differential–action value ( Q and m-type) neuron with correlation also to action choice. The average activity curves in (A), (C), and (E) are smoothed with a Gaussian kernel ( = 50 ms). Double and single asterisks indicate significant difference at P < 0.001 and P < 0.01 in Mann-Whitney U test, respectively.
Fig. 3. Multiple regression analysis of neuronal activity with regressor of action value. (A) A scatter plot of partial regression coefficients of action values for left turn (QL) and right turn (QR). Blue circles, QL-type; red circles, QR-type; green squares, Q-type; magenta triangles, V-type; crosses, m-type. Dark dots indicate neurons with no significant t-values for either regressor. Interrupted lines indicate levels of significant QL and QR slopes at P = 0.05 (t = ±1.97, 140 degrees of freedom). Open symbols indicate the neurons that also have significant regression coefficient of animals' choice, reaction time, or movement time. Letters a, b, and c indicate the example neurons in Fig. 2; A and B, C and D, and E and F, respectively. (B) Pie chart of neurons categorized into the four main types (QL, QR, Q, and m) and three subtypes ( Q and m, QL and m, and QR and m).
Fig. 4. Prediction of action choices and multiple regression analysis of neuronal activity by action values based on a reinforcement learning model K. Samejima et al., Science 310, 1337 -1340 (2005) Published by AAAS
Fig. 1. (A) Frontoparallel magnetic resonance (MR) image of the brain of monkey F FOR MORE ON OFC IN PRIMATE: CHECK THIS OUT!! M. R. Roesch et al., Science 304, 307 -310 (2004) Published by AAAS
Fig. 2. (A) Sequence of events in the reward-penalty task M. R. Roesch et al., Science 304, 307 -310 (2004) Published by AAAS
Fig. 3. Neuronal activity in OF reflects the value conveyed by the incentive cues M. R. Roesch et al., Science 304, 307 -310 (2004) Published by AAAS