Download
1 / 17
170 likes | 422 Vues
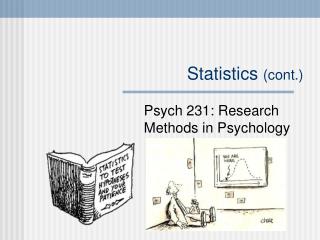
Statistics (cont.). Psych 231: Research Methods in Psychology. Quiz 10 is due on Friday at midnight Class experiment final drafts due in labs this week Please remember to include your commented first draft. Announcements. Inferential statistics used to generalize back. Population.

E N D
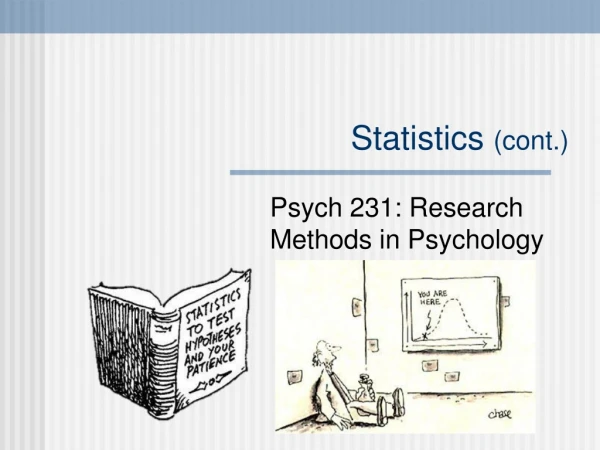
Statistics (cont.) Psych 231: Research Methods in Psychology
Quiz 10 is due on Friday at midnight • Class experiment final drafts due in labs this week • Please remember to include your commented first draft Announcements
Inferential statistics used to generalize back Population Sample A Treatment X = 45 Sample B No Treatment X = 35 • Two approaches • Hypothesis Testing • “There is a statistically significant difference between the two groups” • Confidence Intervals • “The mean difference between the two groups is between 10 ± 4” DepVar Error bars are 95% CIs Inferential Statistics
Observed difference X1 - X2 t = Diff by chance Based on sampling error: Estimate of the Standard Error • Design • 2 separate experimental conditions • Formulae: DepVar Error bars are 95% CIs CI: μ=(X1-X2)±(tcrit)(Diff by chance) Two group design: HT & CI
X1 - X2 T = Diff by chance • Design • 2 separate experimental conditions • Formulae: DepVar Error bars are 95% CIs Margin of error (with a level of confidence) CI: μ=(X1-X2)±(tcrit)(Diff by chance) Two group design: HT & CI
What DOES “confident” mean? • “90% confidence” means that 90% of the interval estimates of this sample size will include the actual population mean CI: μ = (X) ± (tcrit) (diff by chance) 9 out of 10 intervals contain μ Actual population mean μ Interpreting Confidence intervals • R-Psychologist: Interpreting Confidence Intervals • Tan & Tan (2010). The correct interpretation of confidence intervals. Procedings of Signapore Healthcare, 19. Retrieved https://journals.sagepub.com/doi/pdf/10.1177/201010581001900316
Note: How you compute your standard error will depend on your design CI: μ = (X) ± (tcrit) (diff by chance) Using Confidence intervals
Distribution of the test statistic Confidence interval uses the tcrit values that identify the top and bottom tails. Depends on: • α-level • df (degrees of freedom) The upper and lower 2.5% CI: μ = (X) ± (tcrit) (diff by chance) 2.5% 2.5% A 95% CI is like using a “two-tailed” t-test with with α = 0.05 95% of the sample means Using Confidence intervals
Important point! • In text (APA style) example: M = 30.5 ms, 95% CI [18.0, 42.0] • In graphs as error bars • In tables (see more examples in APA manual) Error Bars: Reporting CIs
Note: Make sure that you label your graphs, let the reader know what your error bars are Important point! • In graphs as error bars • Two types typically • Standard Error (SE) • diff by chance • Confidence Intervals (CI) • A range of plausible estimates of the population mean CI: μ = (X) ± (tcrit) (diff by chance) Error Bars: Reporting CIs
Because C.I.s are often recommended or required: • “estimates of appropriate effect sizes and confidence intervals are the minimum expectations” (APA, 2009, p. 34) • Loftus (1993) – took over as editor or Memory & Cognition • “Data analysis: a picture is worth a thousand p-values” (pg. 3) • an editorial in Neuropsychology stated that “effect sizes should always be reported along with confidence intervals” (Rao et al., 2008, p. 1) • In 2005, the Journal of Consulting and Clinical Psychology (JCCP) became the first American Psychological Association (APA) journal to require statistical measures of clinical significance, plus effect sizes (ESs) and associated confidence intervals (CIs), for primary outcomes (La Greca, 2005) • For journals in fields like medicine, physics, chemistry, CIs are the standard Estimation: Why?
Some argue that CIs are more informative than p-values Hypothesis testing & p-values • Dichotomous thinking • Yes/No reject H0 (remember H0 is “no effect”) Neyman-Pearson approach • Strength of evidence Fisher approach Confidence Intervals • Gives plausible estimates of the pop parameter (values outside are implausible) • Provide information about both level and variability • Wide intervals can indicate low power • Good for emphasizing comparisons across studies (e.g., meta-analytic thinking) • Can also be used for Yes/No reject H0 Brief wiki description of these two approaches Estimation: Why? • Geoff Cumming: • Introduction to Estimation: https://www.youtube.com/watch?v=OK6DXfXv8BM
-1.4 5.9 MD = 2.23, 95% CI [-1.4, 5.9] • If we had instead done a hypothesis test on 2 independent samples with an α = 0.05, what would you expect our conclusion to be? H0: “there is no difference between the groups” MD = 2.23, t(34) = 1.25, p = 0.22 - Fail to reject the H0 0 Hypothesis testing with CIs
-1.4 5.9 0.6 6.6 MD = 2.23, 95% CI [-1.4, 5.9] • If we had instead done a hypothesis test on 2 independent samples with an α = 0.05, what would you expect our conclusion to be? H0: “there is no difference between the groups” MD = 2.23, t(34) = 1.25, p = 0.22 • - Fail to reject the H0 0 MD = 3.61, 95% CI [0.6, 6.6] - reject the H0 MD = 3.61, t(42) = 2.43, p = 0.02 Hypothesis testing with CIs
P > 0.05, so fail to reject H0 P < 0.05, so reject H0 Doesn’t include 0 in interval, so reject H0 Doesn’t include 0 in interval, so reject H0 P < 0.05, so reject H0 Does include 0 in interval, so fail to reject H0 CI’s in SPSS output for t-tests
Understanding CI: https://www.youtube.com/watch?v=tFWsuO9f74o • Calculating CI: https://www.youtube.com/watch?v=s4SRdaTycaw • Kahn Academy: • CI and sample size: https://www.youtube.com/watch?v=K4KDLWENXm0 • CI and t-test: https://www.youtube.com/watch?v=hV4pdjHCKuA • CI for Ind Samp: https://www.youtube.com/watch?v=hxZ6uooEJOk (pt 2) • CI and margin of error: https://www.youtube.com/watch?v=UogOJHgJDqs • HT and CI: https://www.youtube.com/watch?v=k1at8VukIbw • HT vs. CI rap: https://www.youtube.com/watch?v=C88fUKAHPn0 • CIs by Geoff Cumming: • Introduction to: https://www.youtube.com/watch?v=OK6DXfXv8BM • Workshop (6 part series) • From my PSY 138 course: Estimation Lab | Lecture • The Minitab Blog: Understanding Hypothesis Tests: Confidence Intervals and Confidence Levels • Wang et al. (2009). A practical guide for understanding confidence intervals and P values. Otolaryngology-Head and Neck Surgery. Retrieved from https://doi.org/10.1016/j.otohns.2009.02.003. Additional resources