Prevent-Teach-Reinforce (PTR): An Efficacious Tier 3 behavior intervention
660 likes | 931 Vues
Prevent-Teach-Reinforce (PTR): An Efficacious Tier 3 behavior intervention. Presented at the 2010 PBIS Leadership Forum Chicago, IL Rose Iovannone , Ph.D., BCBA-D University of South Florida iovannone@fmhi.usf.edu 813-974-1696 .

Prevent-Teach-Reinforce (PTR): An Efficacious Tier 3 behavior intervention
E N D
Presentation Transcript
Prevent-Teach-Reinforce (PTR): An Efficacious Tier 3 behavior intervention Presented at the 2010 PBIS Leadership Forum Chicago, IL Rose Iovannone, Ph.D., BCBA-D University of South Florida iovannone@fmhi.usf.edu 813-974-1696 The contents of this training were developed under grant H324P04003 from the Department of Education.
Objectives • Participants will: • Describe the 5-step PTR Tier 3 support model • Identify the critical components that enhance the success of Tier 3 behavior supports • Discuss application at district level
Agenda • Rationale and conceptual foundation • Research method/outcomes • Overview of PTR process • Suggestions for district-wide application
Tier 3 Function-Based Behavior Interventions in Schools • Issues • Absence of uniform policies & practices • Form versus a process • Expert driven versus collaborative effort • Occasionally contextual fit considered • Limited support/follow-up/training for teacher provided • Result--limited impact on student behavior
What is Prevent-Teach-Reinforce (PTR)? • Research project funded by U.S. Department of Education • University of South Florida • University of Colorado, Denver • Evaluate effectiveness of PTR process vs. “business as usual” • Randomized controlled trial • Intervention “Package” • ONE ‘P’revent; ONE ‘T’each; ONE ‘R’einforce • Based on ABA principles and individual Positive Behavior Support
What is Prevent-Teach-Reinforce (PTR)? • Primary Research Questions: • Is the PTR intervention more effective than control conditions (‘business as usual’) in decreasing severe problem behaviors and increasing pro-social and academic skills of students? • Repeated measures—baseline, post-test, follow-up • Social Skills Rating System (SSRS)-Problem Behavior and Social Skills subscales • Academic Engaged Time (AET)
Participants • K-8th grade • Behavioral difficulties • Intensity– disruption to the learning environment • Frequency— minimum of 1 time per week • Duration– minimum 6 months • General or Special Education • All cognitive levels • All disabilities • Teachers volunteered & nominated 1-3 students • Top externalizers • Systematic Screening for Behavior Disorders (SSBD)
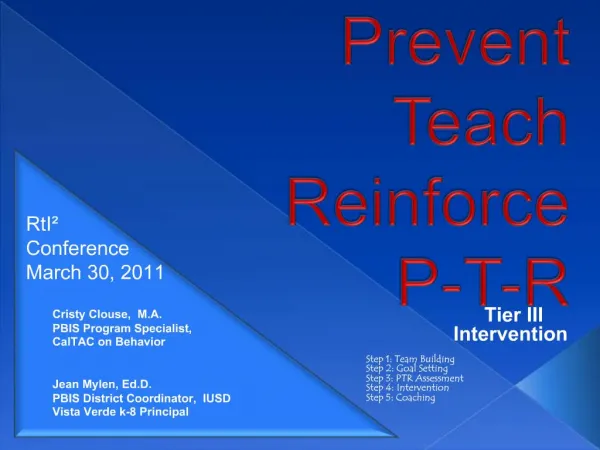
Process • Standardized Individual Positive Behavior Support approach • Intervention teams provided manual, assignments, homework • Five step process aligned with problem solving facilitated by PTR Consultant • Team Development • Goal Setting • Assessment • Intervention and Coaching • Evaluation
Cross-Over Treatment Results p <.01 d = .64
Teacher Outcomes • Fidelity • Majority of teachers achieved .80 • Mean # coaching/training sessions = 3.5 • Prevention higher than Teach and Reinforce • Social Validity • Modified Teacher Acceptability Rating Form (TARF; Reimers & Wacker, 1988)—15 items • 5-point Likert Scale • 124 teachers • Overall—4.16 (.52) • Willingness to carry out plan—4.80 (0.42) • Like the procedures—4.46 (0.64)
Step 1: teaming • Purpose: • Evaluate strengths and weaknesses of team functioning • Outline roles and responsibilities • Determine a consensus-making process • Members (desired • Person with knowledge of student (e.g., Classroom teacher, instructional assistant, parent) • Someone with expertise in functional assessment, behavioral principles (PTR consultant, school-based consultant) • Someone with knowledge of context (e.g., administrator or designee) • Tools • Work style survey • Teacher and Teacher Assistant • Teaming survey
Step 2: Goal Setting • Purpose: • Identify behaviors of greatest concern to the team and possible replacement behaviors (teach) • Prioritize and operationalize behaviors • Develop teacher friendly baseline data collection system • Targeted Areas: • Problem behaviors • Social skills • Academic behaviors
Social Behavior Academic Broad Decrease Increase Case Study—Step 2: Goal Setting
Step 2: Data Collection System • Behavior Rating Scale • Direct Behavior Rating (DBR)—Hybrid assessment combining features of systematic direct observations and rating scales • Efficient and feasible for teacher use • Provides data for decisions • Prioritized and defined behaviors measured • Requires minimum of 1 appropriate and 1 inappropriate behavior
Case Study - Mike: Operational Definitions • Problem behaviors • Screaming—loud, high pitched noise heard outside the classroom • Hitting—anytime Mike touches peers or adults with an open hand, fist, foot, or object while screaming or protesting • Replacement/Appropriate Behaviors • Express frustration appropriately using Dynamite, pictures, or signs to ask for a break or attention • Transition to non-preferred activities: Moving to non-preferred activity and engaging with appropriate verbal expression
BRS Psychometrics (Preliminary) • Kappa coefficients of: • Problem Behavior 1 (n = 105): .82 • Problem Behavior 2 (n = 90) : .77 • Appropriate Behavior 1 (n = 103): .65 • Appropriate Behavior 2 (n = 56): .76
Step 3: PTR Assessment (FBA) • PTR Assessment (FBA) • Each team member independently answers a series of questions related to: • Observed antecedents/triggers of problem behaviors • Functions of the problem behaviors • Consequences ordinarily associated with the problem behaviors • PTR facilitator summarizes input and develops draft hypothesis • Team reaches consensus
Step 3: Case Study – MikeAssessment Summary Table of Problem Behavior Screaming, Hitting
Step 3: Case Study – MikeAssessment of Appropriate Behavior Prosocial
Step 3: Case Study – Mike Hypotheses Inappropriate Appropriate
Step 4: Behavior Intervention Plan • Team selects interventions from each component (P-T-R) • Detailed behavior plan developed • Consultant provides training and on-site assistance with plan implementation • Implementation fidelity evaluated
Step 4: PTR Intervention Coaching/fidelity • Provide training to practice the plan without student (30-90 min.) • PTR Consultant present first day of implementation with student • Provide support in the classroom • Model the plan • Provide feedback • Discuss need for modifications if applicable
Step 5: Evaluation • Is it working? • Daily ratings of behavior • Continuous progress monitoring • BRS • Other data collection forms • Is it being implemented consistently and accurately? • Fidelity ratings • Do we need more data? • Does the plan need to be modified or expanded? • Plan for generalization and maintenance
Review PTR Process • Five-step team-based process • Teacher/team driven • Support provided to teacher/team to implement interventions • Mean number of days for PTR process = 71
References • Manual • Dunlap, G., Iovannone, R., English, C., Kincaid, D., Wilson, K., Christiansen, K., & Strain, P. (2010). Prevent-Teach-Reinforce: A school-based model of individualized positive behavior support.Baltimore:Paul H. Brookes • Journal articles • Iovannone, R., Greenbaum, P., Wei, W., Kincaid, D., Dunlap, G., & Strain, P. (2009). Randomized controlled trial of a tertiary behavior intervention for students with problem behaviors: Preliminary outcomes. Journal of Emotional and Behavioral Disorders,17, 213-225. • Dunlap, G., Iovannone, R., Wilson, K., Strain, P., & Kincaid, D. (2010). Prevent-Teach-Reinforce: A standardized model of school-based behavioral intervention. Journal of Positive Behavior Interventions, 12, 9-22 • Iovannone, R., Greenbaum, P., Wei, W., Kincaid, D., & Dunlap, G. (in review). Reliability of the Individualized Behavior Rating Scale-Strategy for Teachers (IBRS-ST): A Progress Monitoring Tool. Manuscript submitted for publication. • Next steps: • Facilitating schools to scale up • Training key school staff and team members to do process