QI Tool: The Fishbone Diagram
140 likes | 534 Vues
QI Tool: The Fishbone Diagram. EIS Quality Learning Network May 10, 2010. Quality Improvement Tools. What tools can help my HIV care program analyze information and make decisions? . Organizing “Theories of Cause”. Process problems are often caused by: Methods Materials Equipment

QI Tool: The Fishbone Diagram
E N D
Presentation Transcript
QI Tool: The Fishbone Diagram EIS Quality Learning Network May 10, 2010
Quality Improvement Tools What tools can help my HIV care program analyze information and make decisions?
Organizing “Theories of Cause” Process problems are often caused by: Methods Materials Equipment Environment People
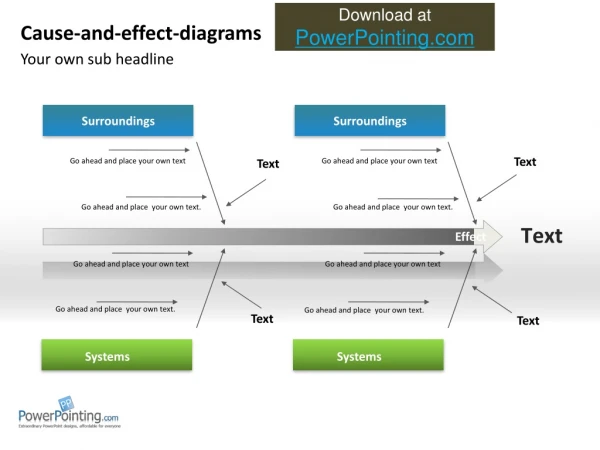
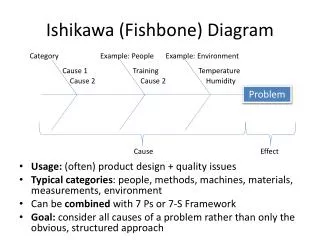
Fishbone Diagram Organizes and displays all causes and sub-causes that may influence a problem, outcome, or effect Helps push people to think beyond the obvious causes, (money, time) to find some causes that they can fix/improve Helps organize potential solutions and make clear who should be involved in solutions Encourages a balanced view Demonstrates complexity of the problem
Common Categories • People: Anyone involved with the process • Methods: How the process is performed and the specific requirements for doing it, such as systems,policies, procedures, rules and regulations • Measurements: Data generated from the process that are used to evaluate its quality • Equipment: computers, tools etc. required to accomplish the job • Materials: Raw materials, parts, pens, paper, etc. used to produce the final product • Environment: The conditions, such as location, time, temperature, and culture in which the process operates
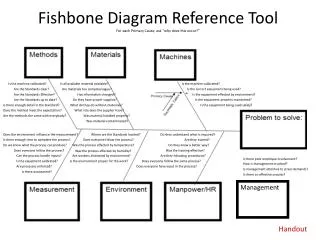
Creating a Fishbone Diagram Skeleton Equipment Environment Computer System down for routine maintenance Low show rate for appointments Patients Patient unaware of appointment Procedures People
Fishbone Diagram: Practice(20 Minutes) • Write down the problem (fish head) • Decide on categories and draw skeleton (e.g., Environment, People, Equipment, Materials, Procedures, Policies, Measurements) • Brainstorm as many possible causes as you can and fill in the diagram • Ask “why does this happen?” 3 to 5 times • Check for logic, completeness and balance Practice Problem: Low return for confirmatory tests Please select a facilitator/recorder & report back to full group
Have the Diagram, Now What? Need to test the theories On to your quality improvement work!
Resources • NQC Quality Academy On-line Training, Module 14: Useful QI Tools NationalQualityCenter.org/QualityAcademy • American Society for Quality (ASQ) www.asq.org/learn-about-quality/causeanalysistools/overview/fishbone.html • Ishikawa, Kaoru Introduction to Quality Control (Translator: J. H. Loftus) 1990 • Nancy R. Tague The Quality Toolbox, American Society for Quality 2005