Retrieving and Viewing Protein Structures from the Protein Data Base
250 likes | 356 Vues
Learn about how the Protein Data Base (PDB) provides access to protein structures, its growth over the years, importance, and visualization tools for understanding complex protein structures.

Retrieving and Viewing Protein Structures from the Protein Data Base
E N D
Presentation Transcript
Retrieving and Viewing Protein Structures from the Protein Data Base 7.88J Protein Folding Prof. David Gossard Room 3-336, x3-4465 gossard@mit.edu September 15, 2004
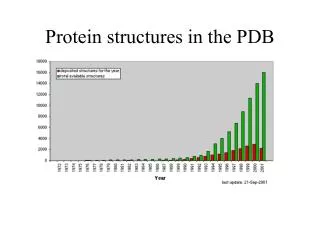
Protein Data Base • Established in 1971 • Funded by NSF, DOE, NIH • Operated by Rutgers, SDSC, NIST • Purpose: Make protein structure data available to the entire scientific community • In the beginning: “less than a dozen” protein structures • Currently has 27,112 protein structures • Growing at 20% per year • New structures 50 times larger than those in 1971 are commonplace
Why the “Knee in the Curve”? • Engineered bacteria as a source of proteins • Improved crystal-growing conditions • More intense sources of X-rays • Cryogenic treatment of crystals • Improved detectors & data collection • New method - NMR: • Accounts for 15% of new structures in PDB • Enables determination of structure of proteins in solution • “Protein Structures: From Famine to Feast”, Berman, et.al. • American Scientist v.90, p.350-359, July-August 2002
Why is the PDB Important? • Rapid, extensive access to new structure data • “Collective Leverage” for … • Understanding molecular machinery • Rational drug design • Engineering new molecules • Structural genomics • etc…
Not all Structures are Different • PDB Growth in “New Folds”
Structure vs Sequence • New protein sequences are being discovered much more quickly than new protein structures are being solved • Currently, known protein sequences vastly outnumber known protein structures • The “sequence-structure” gap continues to widen
Point of Information • Today’s material is: • a subset of the information available to you in online tutorials • presented to “get you started” quickly and to “shorten the learning curve” • not exhaustive or even sufficient => should be augmented by actually working through the online tutorials
PDB Website http://www.rcsb.org/pdb/ Enter what you know…
Query Result Browser Which one do I want? Let’s look at this one …
Structure Explorer Yep, that’s the right one… View it… Download it…
View Structure Static Images
Download/Display Display the file header… Download the file… (Select this file format)
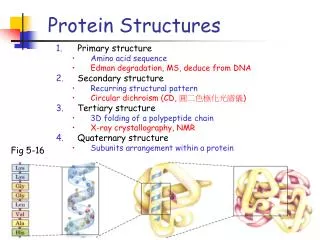
Visualizing Proteins • High complexity • Multiple levels of structure • Important properties are “distributed” throughout the 3D structure Branden & Tooze
Visualization Objectives • Structure • Backbone; secondary, tertiary & quaternary • Side chain groups • Hydrophobic, charged, polar, acidic/base, etc. • Cross-links • Hydrogen bonds, disulfide bonds • Surfaces • VanderWaals, solvent-accessible • Charge distributions, distances & angles, etc.
Display Conventions Wireframe Ribbon Spacefill Molecular Surface
History of Visualization of Macromolecules • http://www.umass.edu/microbio/rasmol/history.htm Sculpture of human neutrophil collagenase by Byron Rubin on permanent exhibition at the Smithsonian Institution Washington DC
Important URL’s • Protein Data Base • http://www.rcsb.org/pdb/ • Chime • http://www.mdlchime.com/chime/ • SwissPDB • http://www.expasy.ch/spdbv/
Visualization Tools • Viewers (free) • 1960’s : MAGE, RasMol, Chime • 2004 : SwissPDB, Protein Explorer, Cn3D, etc. • Operating systems – Unix, Windows, Mac • Our choice (arbitrary) : • Chime (plug-in to NETSCAPE) • SwissPDB (stand-alone)
SwissPDB – Toolbar Center Distance between two atoms Angle between three atoms Measure omega, phi and psi angles Provenance of an atom Display groups a certain distance from an atom Translate Zoom Rotate
Control Panel Chain Helix/sheet Residue Color target Main chain Color Side chain Label Surface Ribbon
Demo • Bovine Pancreatic Ribonuclease • 124 amino acids • 8 cysteines (4 di-sulfide bonds) • 26-84 • 40-95 • 58-110 • 65-72