Achievement
Achievement. In America 2002 University of Maryland, College Park --- 6/20/02. The Education Trust, Inc. Paul F. Ruiz. PhD. Section I: How Many Students Make It Through?. Grad Rates Flat; More Non-Traditional Diplomas. (18-24 Year-Old High School Completes).


Achievement
E N D
Presentation Transcript
Achievement In America 2002 University of Maryland, College Park --- 6/20/02 The Education Trust, Inc. Paul F. Ruiz. PhD
Grad Rates Flat; MoreNon-Traditional Diplomas (18-24 Year-Old High School Completes) Source: US Department of Commerce, Bureau of the Census, Current Population Survey (CPS) October 1998
Students Graduate From High School At Different Rates, 1998 Source: US Bureau of Census, Current Population Reports, Educational Attainment in the United States: March 1998 (p. 20-513), Detailed Tables No. 2
Most High School Grads Go On To Postsecondary Source: NELS: 88, Second (1992) and Third (1994) Follow up; in, USDOE, NCES, Condition of Education 1997, Supplemental Table 9-1
Even Low Achieving Grads Go On To Postsecondary Source: NELS: 88, Second (1992) and Third Follow up (1994); in, USDOE, NCES, Condition of Education 1997, p. 64
Low-Income Students Attend 4-Year Colleges at Lower Rates Source: NELS: 88, Second (1992) and Third Follow up (1994); in, USDOE, NCES, NCES Condition of Education 1997 p. 64
Fewer African Americans and Latinos Go to College Directly After High School Source: US Department of Commerce, Bureau of the Census, October Current Population Survey 1998, in NCES, The Condition of Education 2000, p. 149
Many Freshmen Must Take Remedial Courses 1995 Source: USDOE, NCES, PEQUIS, Remedial Education at Higher Education Institutions in fall 1995 (1996), in The Condition ofEducation 1999, p. 88
College Freshmen Not Returning for Sophomore Year Source: Tom Mortensen, Postsecondary Opportunity, No. 89, November 1999
College Freshmen Graduating Within Six Years (NCAA Division I) Source: 1999 NCAA Division I Graduation Rates Report, p.636
Of Every 100 White Kindergartners: (24 Year-Olds) Source: US Bureau of Census, Current Population Reports, Educational Attainment in the United States; March 2000, Detailed Tables No. 2
Of Every 100 African American Kindergartners: (24 Year-Olds) Source: US Bureau of Census, Current Population Reports, Educational Attainment in the United States; March 2000, Detailed Tables No. 2
Of Every 100 Latino Kindergartners: (24 Year-Olds) Source: US Bureau of Census, Current Population Reports, Educational Attainment in the United States; March 2000, Detailed Tables No. 2
Of Every 100 Native American Kindergartners: (24 Year Olds)
College Graduates by Age 24 Source: Tom Mortenson, Research Seminar on Public Policy Analysis of Opportunity for Post Secondary, 1997.
In K-12, Achievement Slightly Up in Some Subjects, Down in Others: Between 1970 and 1988, the gap between groups narrowed. Since 1988, the gap has grown or remained the same.
Gap Narrows, Then Widens NAEP Reading Scores, 17 Year-Olds Source: US Department of Education, National Center for Education Statistics. NAEP 1999 Trends in Academic Progress (p. 107) Washington, DC: US Department of Education, August 2000
Gap Narrows, Then Widens NAEP Math Scores, 13 Year-Olds Source: US Department of Education, National Center for Education Statistics. NAEP 1999 Trends in Academic Progress (p. 108) Washington, DC: US Department of Education, August 2000
Too Few 17 Year-Olds Demonstrate Strong Reading Skills Source: USDOE, NCES, 1999 NAEP Summary Data Tables
Too Few 17 Year-Olds Demonstrate Strong Math Skills Source: USDOE, NCES, 1999 NAEP Summary Data Tables
African American and Latino 17 Year Olds Do Math at Same Levels As White 13 Year Olds Source: NAEP 1999 Long Term Trends Summary Tables (online)
African American and Latino 17 Year Olds Read at Same Levels as White 13 Year Olds Source: Source: NAEP 1999 Long Term Trends Summary Tables (online)
US STUDENTS COMPETITIVE IN THE EARLY GRADES, BUT FALL BEHIND BY THE END OF HIGH SCHOOL
Source: NCES 1999-081R, Highlights From TIMSS 2000 by The Education Trust, Inc.
Source: NCES 1999-081R, Highlights From TIMSS 2000 by The Education Trust, Inc.
What Adults Say: they’re poor; their parents don’t care; come to school without breakfast; not enough books; not enough parents...
But if they’re right, then why are poor and minority children performing so high in...
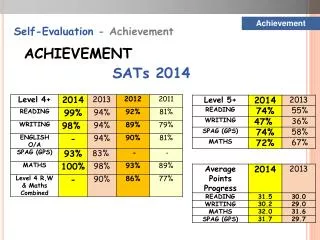
Wrigley Elementary • 78% Low-Income • 3rd Highest Performing in State in Reading • 6th Highest Performing in State in Writing KENTUCKY
Mount Royal Elementary/Middle, Baltimore, MD • 99% African American • 73% Low-Income • Highest Performing in State on the state’s 5th grade Math test. MARYLAND * or tied
El Paso: Passing MathCombined Districts (EPISD,YISD,SISD), Accountability Subset: Grade 3-8 and 10
4th Grade Math African American Gains Between 1992 and 2000 Source: USDOE, NCES, National Assessment of Educational Progress (NAEP) Summary Data Tables
4th Grade Math Latino Gains Between 1992 and 2000 Source: USDOE, NCES, National Assessment of Educational Progress (NAEP) Summary Data Tables
Connecticut: Gains in Grade 4 Reading Outpace the Nation, 1994-98 Source: NCES, National Assessment of Educational Progress
8th Grade Writing: African Americans in Texas Perform as Well or Better Than Whites in 7 States Source: NCES, National Assessment of Educational Progress
What Students Say: We CAN Learn, But... some teachers don’t know their subjects; counselors underestimate our potential; principals dismiss concerns; expectations low.
#1. Send Clear and Unambiguous Signals The Role of Standards, Assessments, Accountability
Historically, No Agreement on What Students Should Learn Or What Kind of Work Is Good Enough