Achievement Standard
AS 91581 . Achievement Standard. PPDAC cycle. One of the principles: Grade distinctions should not be based on the candidate being required to acquire and retain more subject-specific knowledge. . P ose a question P lan D ata A nalyse C onclude Back to question.


Achievement Standard
E N D
Presentation Transcript
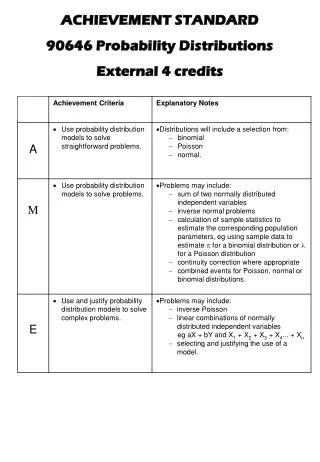
AS 91581 Achievement Standard
One of the principles: Grade distinctions should not be based on the candidate being required to acquire and retain more subject-specific knowledge.
Pose a question • Plan • Data • Analyse • Conclude • Back to question Assessment is based on the PPDAC
Using the statistical enquiry cycle to … investigate bivariate measurement data involves: posing an appropriate relationship question using a given multivariate data set selecting and using appropriate displays identifying features in data finding an appropriate model describing the nature and strength of the relationship and relating this to the context using the model to make a prediction communicating findings in a conclusion
Using the statistical enquiry cycle to … investigate bivariate measurement data involves: posing an appropriate relationship question using a given multivariate data set selecting and using appropriate displays identifying features in data finding an appropriate model describing the nature and strength of the relationship and relating this to the context using the model to make a prediction communicating findings in a conclusion
Posing relationship questions Possibly the most important component of the investigation Time spent on this component can determine the overall quality of the investigation This component provides an opportunity to show justification (M) and statistical insight (E)
Posing relationship questions What makes a good relationship question? It is written as a question. It is written as a relationship question. It can be answered with the data available. The variables of interest are specified. It is a question whose answer is useful or interesting. The question is related to the purpose of the task. Think about the population of interest. Can the results be extended to a wider population?
We need to understand the variables before we can make any progress. WHOA!
Think about which variables could be related JUSTIFY YOUR REASONING
Developing question posing skills Pose several relationship questions (written with reasons/justifications) Possibly critique the questions The precise meaning of some variables may need to be researched
Different relationship questions Is there a relationship between variable 1 and variable 2 for Hector’s dolphins? What is the nature of the relationship between variable 1 and variable 2 for Hector’s dolphins? Can variable 1 be used to predict variable 2 for Hector’s dolphins?
We might like to ask ourselves why we would want to know about any relationships that might exist” Research about the situation helps develop ideas
A morphological study of skull and mandible features was undertaken to examine variation between the most genetically distinct population, occurring on the west coast of the North Island, and the populations around the South Island. Univariate and principal component analyses demonstrate that the North Island population can be differentiated from the southern populations on the basis of several skeletal characters.
Developing question posing skills It is expected that you do some research: Improve knowledge of variables and context May find some related studies that creates potential for integration of statistical and contextual knowledge
Developing question posing skills Draw some scatter plots to start to investigate your questions Reduce, add to and/or prioritise their list of questions Possibly critique the questions again
Appropriate displays • Which variable goes on the x-axis and which goes on the y-axis? • It depends on the question and on the variables of interest • Is there a relationship between zygomatic width and rostrum length for Hector’s dolphins?
Is there a relationship between zygomatic width and rostrum length for Hector’s dolphins?” Variables on axes
Is there a relationship between zygomatic width and rostrum length for Hector’s dolphins?” This is a straight forward relationship question.
Is there a relationship between zygomatic width and rostrum length for Hector’s dolphins?” This is a ‘correlation’ type question.
There is no difference in the roles of each variable so it does not matter which variable goes on the x-axis and which goes on the y-axis. For this question it does not matter which variable goes on each axis. Is there a relationship between zygomatic width and rostrum length for Hector’s dolphins?”
Which variable goes on the x-axis and which goes on the y-axis? • It depends on the question and on the variables of interest • Is there a relationship between zygomatic width and rostrum length for Hector’s dolphins? • Is there a relationship between rostrum width at midlengthand rostrum width at base for Hector’s dolphins?
Variables on axes • Is there a relationship between rostrum width at midlength and rostrum width at the base for Hector’s dolphins?
“I think that the width at the base could help determine (or influence) the width at midlength.” • Is there a relationship between rostrum width at midlength and rostrum width at the base for Hector’s dolphins?
Rostrum length at base (RWB) the explanatory variable and rostrum width at midlength the response variable.. • Is there a relationship between rostrum width at midlength and rostrum width at the base for Hector’s dolphins?
Which variable goes on the x-axis and which goes on the y-axis? • It depends on the question and on the variables of interest • Is there a relationship between zygomatic width and rostrum length for Hector’s dolphins? • Is there a relationship between rostrum width at midlengthand rostrum width at the base for Hector’s dolphins? • For Hector’s dolphins, can rostrum length be used to predict mandible length?
Variables on axes • For Hector’s dolphins, can rostrum length be used to predict mandible length?
This is a regression question • For Hector’s dolphins, can rostrum length be used to predict mandible length?
It is clear that we are interested in how mandible length responds to rostrum length, so rostrum length is the explanatory variable and mandible length is the response variable.
Experiments: • If the data comes from an experiment then some variables would be classed as input variables and others as output variables. It would make sense to see how an input variable affects an output variable. The input variable would be the explanatory variable and the output variable would be the response variable.
Using the statistical enquiry cycle to … • investigate bivariate measurement data involves: • posing an appropriate relationship question using a given multivariate data set • selecting and using appropriate displays • identifying features in data • finding an appropriate model • describing the nature and strength of the relationship and relating this to the context • using the model to make a prediction • communicating findings in a conclusion
Same approach whether linear or non-linear • investigate bivariate measurement data involves: • posing an appropriate relationship question using a given multivariate data set • selecting and using appropriate displays • identifying features in data • finding an appropriate model • describing the nature and strength of the relationship and relating this to the context • using the model to make a prediction • communicating findings in a conclusion
Features, model, nature and strength • Generate the scatter plot using iNZight • (or excel) • RWM vs RWB
Features, model, nature and strength • Generate the scatter plot • Let the data speak • Use your eyes (visual aspects) • Write about what you see, not what you don’t see • DON’T fit a model yet
Features, model, nature and strength • Template for features (but allow flexibility) • Trend • Association (nature) • Strength (degree of scatter) • Groupings/clusters • Unusual observations • Other (e.g., variation in scatter) • If there are groupings evident in the plot then it may be better to explore the groups separately at this stage.
Trend • From the scatter plot it appears that there is a lineartrend between rostrum width at base and rostrum width at midlength. • Use descriptions of variables rather than variable names- keeps it contextual. • This is a reasonable expectation because two different measures on the same body part of an animal could be in proportion to each other.
Association • The scatter plot also shows that as the rostrum width at base increases the rostrum width at midlengthtends to increase. • This is to be expected because dolphins with small rostrums would tend to have small values for rostrums widths at base and midlength and dolphins with large rostrums would tend to have large values for rostrums widths at base and midlength.
Association • The scatter plot also shows that as the rostrum width at base increases the rostrum width at midlengthtends to increase. • A contextual description is preferable to one using technical terms. • However it is appropriate to use terms such as positive, negative or no association, but they are better used after the contextual description.
Higher level considerations • This is to be expected because dolphins with small rostrums would tend to have small values for rostrums widths at base and midlength and dolphins with large rostrums would tend to have large values for rostrums widths at base and midlength. • You should reflect on the nature of the relationship with respect to the context. • At this stage you could acknowledge (if the data does not come from a randomised experiment) that they have found only a statistical relationship and that this does not necessarily imply a causal relationship between the variables.
Higher level considerations • Alternatively, if the data comes from a suitable experiment you could make a causation claim in your conclusion. • You may acknowledge that other variables (which they must name) would impact on the (response) variable, and suggest how they might impact on the variable. For example, gender, age, etc. and perhaps show these and compare.
Find a model • Because the trend is linear I will fit a linear model to the data. • You must state why you • have selected this • particular model. • The line is a good model for the data because for all values of rostrum width at base, the number of points above the line are about the same as the number below it.
Find a model • Because the trend is linear I will fit a linear model to the data. • You must state why you • have selected this • particular model. • Don’t show the equation yet. There are still features in the data to comment on.