
Hands-On Training with Syndicated Data for Brand Insights and Market Strategies
This engaging course provides students with practical experience in using syndicated data to generate actionable market insights for brands and product categories. Students will explore key metrics, understand causality, and evaluate sales influencers. The course includes case studies, guest speakers from industry leaders, and hands-on labs focused on market response analysis, promotional effectiveness, and customer data leveraging. By the end, students will grasp how to aggregate and utilize structured and unstructured data for strategic planning and decision-making.

Hands-On Training with Syndicated Data for Brand Insights and Market Strategies
E N D
Presentation Transcript
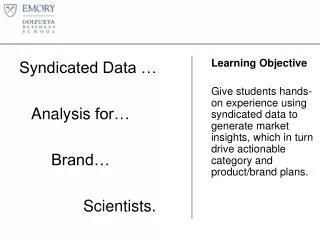
Syndicated Data … Analysis for… Brand… Scientists. Learning Objective Give students hands-on experience using syndicated data to generate market insights, which in turn drive actionable category and product/brand plans.
Some Questions We Often Ask • Score keeping • How are we doing vis-à-vis last year? the competition? the status quo? • Understand “causality” • What factors influence our sales and share? What is their relative influence? • Prescription • What should we do?
What is Syndicated data? • Aggregation of structured or unstructured data from multiple people or companies for redistribution to the market. • Examples and Uses: • Sales: point-of-sale, consumer panel, shopper card • Attitudes & Trends: survey data (Mintel, Simmons, Forrester) • Economic: Repackaged public or government data • Media: TV/Radio/Print measurement, social media (facebook), mobile, internet (Buzz, ads, search), couponing Source: Eric Schmidt
Big Data 15 out of 17 sectors in the United States have more data stored per company than the US Library of Congress *McKinsey Global Institute, June 2011 Source: Eric Schmidt
Market Research Companies by U.S. Revenue Source: http://www.marketingpower.com/ResourceLibrary/Publications/MarketingNews/2012/6-30-12/Hono-Top-50-Chart.pdf
Approximate Schedule • Day 1 (Wed. Feb.27) • Intro; Scanner Data; Intro to Market Response Analysis; Experimentation Lab; Market Response Analysis Lab; Category Analysis Lab; Resource Allocation • Day 2 (Thurs. Feb.28) • Promotion Analysis; Misc. Econometrics Topics; Vendor Perspective (guest speaker); Mktg Mix Models (guest speaker); Web Analytics (guest speaker); Social Media (guest speaker); SAS Programming Lab • Day 3 (Fri. Mar.1) • Brita Case Study; Valuing Customers; Leveraging Customer Databases (guest speaker); Reading Published Studies