Download
1 / 39
390 likes | 499 Vues
Explore how climate change affects precipitation intensity, frequency, and phase, influencing droughts, floods, and global water systems. Understand the implications for ecosystems and human activities.

E N D
Potential impacts of climate change on precipitation Kevin E. Trenberth NCAR
Sayings that describe changes in precipitation with climate change Sunshine is delicious, rain is refreshing, wind braces us up, snow is exhilarating; there is really no such thing as bad weather, only different kinds of good weather. John Ruskin The rich get richer and the poor get poorer! More bang for the buck! It never rains but it pours!
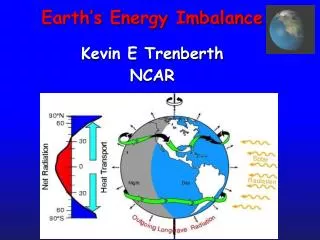
Global warming: Controlling Heat The presence of moisture affects the disposition of incoming solar radiation: Evaporation (drying) versus temperature increase. Human body: sweats Homes: Evaporative coolers (swamp coolers) Planet Earth: Evaporation (if moisture available) e.g., When sun comes out after showers, the first thing that happens is that the puddles dry up: before temperature increases.
Precipitable water Precipitation
How should precipitation change as climate changes? • Usually only total amount is considered • But most of the time it does not rain • The frequency and duration (how often) • The intensity (the rate when it does rain) • The sequence • The phase: snow or rain The intensity and phase affect how much runs off versus how much soaks into the soils.
Daily Precipitation at 2 stations Monthly Amount 75 mm Amount 75 mm A B Frequency 6.7% Intensity 37.5 mm Frequency 67% Intensity 3.75 mm drought wild fireslocal wilting plantsfloods soil moisture replenished virtually no runoff
Frequency of precipitation: oceans Estimated frequency of occurrence (%) of precipitation from Cloudsat observations find precipitation 10.9% of time over oceans (Ellis et al 2009 GRL)
Most precipitation comes from moisture convergence by weather systems • The intermittent nature of precipitation (average frequency over oceans is 11%) means that moderate or heavy precipitation • Can not come from local column. • Can not come from E. • Hence has to come from transport by storm-scale circulation into storm. • On average, rain producing systems • (e.g., extratropical cyclones; thunderstorms) • reach out and grab moisture from distance about • 3 to 5 times radius of precipitating area.
Changes in ocean state from 1950-1960’s to 1990-2000’s (IPCC 2007 Figure 5.18)
GPCP Global precipitation 1979-2008 Wentz 2007: 1987-2006
Increases Decreases Land precipitation is changing significantly over broad areas Smoothed annual anomalies for precipitation (%) over land from 1900 to 2005; other regions are dominated by variability. IPCC
Precipitation Observed trends (%) per decade for 1951–2003 contribution to total annual from very wet days > 95th %ile. Alexander et al 2006 IPCC AR4 Heavy precipitation days are increasing even in places where precipitation is decreasing.
Drought is increasing most places Mainly decrease in rain over land in tropics and subtropics, but enhanced by increased atmospheric demand with warming The most important spatial pattern (top) of the monthly Palmer Drought Severity Index (PDSI) for 1900 to 2002. The time series (below) accounts for most of the trend in PDSI. Dai et al 2004 IPCC 2007
Trends 1948-2004 in runoff by river basin Based on river discharge into ocean Dai et al.2009
SSM/I era GPCP satellite era Estimated water year (1 Oct-30 Sep) land precipitation and river discharge into global oceans based on hindcast from output from CLM3 driven by observed forcings calibrated by observed discharge at 925 rivers. Note: 1) effects of Pinatubo; 2) downward trend (contrast to Labat et al (2004) and Gedney et al (2006) owing to more data and improved missing data infilling) Trenberth and Dai 2007; Dai et al. 2009
Mount Pinatubo in June 1991 had a pronounced effect on land precipitation and runoff (3.6). Ocean precipitation was also slightly below normal, and the global values are lowest on record. Trenberth and Dai 2007
Geoengineering: One proposed solution to global warming: • Emulate a volcano: Pinatubo • Cut down on incoming solar radiation • Is the cure worse than the disease?
Geoengineering • Indications are that • climate models over-estimate the cooling with volcanoes (overestimate the benefits) • Climate models under-estimate the changes in precipitation and the hydrological cycle (underestimate the bad side effects) • Costs are high and go on forever • There is not an adequate observing system to tell if the effects are doing what they are supposed to, or saying just what is happening. • Holding out false hope of a magic pill solution works against taking seriously needed actions. • Who is to make decisions for all of humanity when there are potentially bad side effects that hurt some more than others? (Ethical issues)
Flood damages: • Local and national authorities work to prevent floods • (e.g., Corp of Engineers, Bureau of Reclamation, Councils) • Build ditches, culverts, drains, levees • Can backfire! • 2. Deforestation in many countries: • Leads to faster runoff, exacerbates flooding • 3. Increased vulnerability to flooding through • settling in flood plains and coastal regions • Increases losses. • Flooding statistics NOT useful for • determining weather part of flooding!
Factors in Changes in Precipitation It never rains but it pours!
How should precipitation P change as the climate changes? • With increased GHGs: increased surface heating evaporation E and P • ClausiusClapeyron: water holding capacity of atmosphere goes up about7% per °C. • With increased aerosols, E and P • Net global effect is small and complex • Models suggest E and P 2-3% per °C.
Controls on the changes in net precipitation 1.+2. Evaporation is limited by energy available 3. Changes in atmospheric radiation 2. Changes in aerosol 1. Changes in cloud 3. Latent heating has to be mostly balanced by net LW radiative losses (SH small) 4. Over land: Latent heating is partly balanced by sensible heat 2000-2005 Trenberth et al 2009
Aerosols have multiple effects: • Direct – cooling • from sulfate aerosol: • milky white haze, reflects • Direct – absorbing • e.g. black carbon • Indirect – changes cloud • Form cloud condensation nuclei, more droplets, brighter cloud; • Less rain, longer lasting cloud; • Absorption in cloud heats and burns off cloud • Less radiation at surface means less evaporation and less cloud Lifetime only a week or so: Very regional in effects Ramanathan et al 2001 Profound effects at surface: Short-circuits hydrological cycle
Aerosol indirect effects Lohmann and Feichter 2005
TOA radiation does not change (much) in equilibrium Controls on the changes in net precipitation If the only change in climate is from increased GHGs: then SW does not change (until ice melts and if clouds change), and so OLR must end up the same. But downwelling and net LW increases and so other terms must change: mainly evaporative cooling. Transient response may differ from equilibrium (see Andrews et al. 09) Land responds faster. Radiative properties partly control rate of increase of precipitation.: Stephens and Ellis 2008 2000-2005 Trenberth et al 2009
Observations show that this is happening at the surface and in lower atmosphere: 0.55C since 1970 over global oceans and 4% more water vapor. This means more moisture available for storms and an enhanced greenhouse effect. More intense rains (or snow) but longer dry spells Trenberth et al 2003 Total water vapor Air holds more water vapor at higher temperatures A basic physical law tells us that the water holding capacity of the atmosphere goes up at about7% per degree Celsius increase in temperature. (4% per F)
Higher temperatures: heavier precipitation Percent of total seasonal precipitation for stations with 230mm±5mm falling into 10mm daily intervals based on seasonal mean temperature. Blue bar -3˚C to 19˚C, pink bar 19˚C to 29˚C, dark red bar 29˚C to 35˚C, based on 51, 37 and 12 stations. As temperatures and es increase, more precipitation falls in heavy (over 40mm/day) to extreme (over 100mm/day) daily amounts. Karl and Trenberth 2003
Precipitation vs Temperature Winter high lats: air can’t hold moisture in cold; storms: warm and moist southerlies. Clausius-Clapeyron effect TP Nov-March Correlations of monthly mean anomalies of surface temperature and precipitation. May-September Negative: means hot and dry or cool and wet. Positive: hot and wet or cool and dry (as in El Nino region). Trenberth and Shea 2005 Tropics/summer land: hot and dry or cool and wet Rain and cloud cool and air condition the planet! PT Oceans: El Nino high SSTs produce rain, ocean forces atmosphere SSTP
Temperature vs Precipitation Cyclonic regime Cloudy: Less sun Rain: More soil moisture Surface energy: LH SH Rain Temperature Anticyclonic regime Sunny Dry: Less soil moisture Surface energy: LHSH Rain Temperature Summer: Land Strong negative correlations Does not apply to oceans
Air holds more water vapor at higher temperatures • TheC-C effectis important over oceans (abundant moisture) and over land at mid to high latitudes in winter. • “The rich get richer and the poor get poorer”. More moisture transports from divergence regions (subtropics) to convergence zones. Result: wet areas get wetter, dry areas drier (Neelin, Chou) • But increases in moist static energy andgross moist instabilityenablesstronger convection and more intense rains. Hadley circulation becomes deeper. • Hence itchanges windsand convergence: narrower zones. • “Upped ante” precip decreases on edges of convergence zones as it takes more instability to trigger convection. (Neelin, Chou)
How else should precipitation P change as the climate changes? • “More bang for the buck”: With increased moisture, the winds can be less to achieve the same transport. Hence the divergent circulation weakens. (Soden & Held) • Changes in characteristics: more intense less frequentrains(Trenberth et al) • Changed winds change SSTs: ITCZ, storm tracks move: dipoles Example: ENSO • Type: snow to rain • Snow pack melts sooner, runoff earlier, summer soil moisture less, risk of summer drought, wildfires increases
Model predictions “Rich get richer, poor get poorer” Projections: Combined effects of increased precipitation intensity and more dry days contribute to lower soil moisture 2090-2100 IPCC
IPCC AR4 Model Predicted Changes: 1980-99 vs. 2080-99 Precip. Intensity 2% K-1 -0.8% K-1 Precip. Frequency Global Temp. Change (K) Global Temp. Change (K) Precipitable Water Precip. Amount 1.7% K-1 9% K-1 B1 A2 Global Percentage Change (%) 1 2 3 4 1 2 3 4 1 2 3 4 1 2 3 4 (Sun et al.07)
Precip. Amount Precip. Frequency A2 A1B B1 There is higher frequency of more intense events contributing to the total amount. The % change is over 100% for A1B and A2. Percentage Change (%) (2080-2099 vs. 1980-1999) (Sun et al.’07)
Model precipitation changes R • Oceans • 2-3% per K increase in E and P • C-C effect 4-6% • Sfc wind speed 0.01m/s • Sea-air T diff 0.05K • Sfc RH 0.2% AR4 models A1B 2046 to 2101 Richter and Xie2008 Also: Trenberth 1998 Stephens and Ellis 2008 Allan and Ingram 2002
Precipitation in models:“all models are wrong, some are useful” A challenge: Amount: distribution: double ITCZ Frequency: too often Intensity: too low Runoff: not correct Recycling: too large Diurnal cycle: poor Lifetime: too short (moisture) Issues: Tropical transients too weak Hurricanes MJOs Easterly waves
All models are wrong, some are useful! There are many analyses of models, but models are demonstrably poor at many aspects of the hydrological cycle. Courtesy Francis Zwiers
Water servesas the “air conditioner” of the planet. Rising greenhouse gases are causing climate change, semi-arid areas are becoming drier while wet areas are becoming wetter. Increases in extremes (floods and droughts) are already here. Water management:- dealing with how to save in times of excess for times of drought – will be a major challenge in the future. Lake Powell