Download
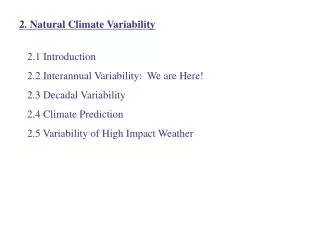
1 / 60
600 likes | 636 Vues
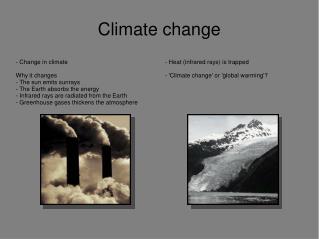
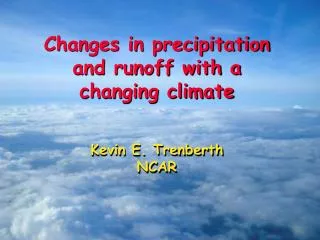
The Earth's climate system involves the transformation of radiant energy into various forms, driven by atmosphere and oceans, with a delicate balance between incoming and outgoing radiation. This balance impacts weather patterns, ocean currents, and climate overall, influenced by factors like greenhouse gases and natural processes. Learn about the role of atmosphere, oceans, land, and ice in shaping Earth's climate and the interconnected systems affecting climate change.

E N D
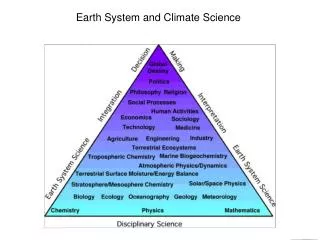
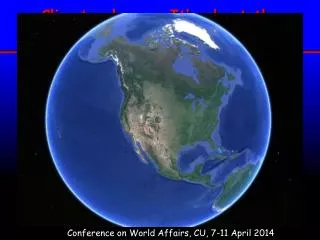
The Earth’s Climate System: Variability and change Kevin E. Trenberth NCAR
Energy on Earth The incoming radiant energy is transformed into various forms (internal heat, potential energy, latent energy, and kinetic energy) moved around in various ways primarily by the atmosphere and oceans, stored and sequestered in the ocean, land, and ice components of the climate system, and ultimately radiated back to space as infrared radiation. An equilibrium climate mandates a balance between the incoming and outgoing radiation and that the flows of energy are systematic. These drive the weather systems in the atmosphere, currents in the ocean, and fundamentally determine the climate. And they can be perturbed, with climate change.
The Earth would be -19°C (-2°F) without atmosphere. 99% of the atmosphere is nitrogen and oxygen which are transparent to radiation The Natural Greenhouse Effect: clear sky CH4 N20 6% O3 8% Carbon Dioxide 26% Water Vapor 60% Clouds also have a greenhouse effect Kiehl and Trenberth 1997
Net observed radiation TOA Trenberth & Stepaniak, 2003
The role of the atmosphere in energy • The atmosphere is the most volatile component of climate system • Winds in jet streams exceed 100 mph or even 200 mph; winds move energy around. • Thin envelope around planet 90% within 10 miles of surface 1/400th of the radius of Earth; clouds appear to hug the surface from space. • The atmosphere does not have much heat capacity • “Weather” occurs in troposphere (lowest part) • Weather systems: cyclones, anticyclones, cold and warm fronts tropical storms/hurricanes move heat around: mostly upwards and polewards
George Hadley (1685-1768), English lawyer and scientist. “I think the cause of the general Trade-winds have not been explained by any of those who have wrote on that subject” (1735) The overturning Hadley cells are the main way the atmosphere transports energy polewards in low latitudes
“Extratropical Storms” Cyclones and anticyclones are the main way of transporting energy polewards in extratropics. Winds converging into the low, pull cold air from the poles toward the equator, and warm air from the equator to the poles. Where they meet is where we find fronts, bringing widespread precipitation and significant weather, like thunderstorms. Source: USA TODAY research by Chad Palmer, Graphic by Chuck Rose
Role of Oceans • The oceans cover 70.8% of the Earth’s surface. • The oceans are wet: water vapor from the surface provides source for rainfall and thus latent heat energy to the atmosphere. • The heat capacity of the atmosphere is equivalent to that of 3.5 m of ocean. The oceans slowly adjust to climate changes and can sequester heat for years. • The ocean is well mixed to about 20 m depth in summer and over 100 m in winter. An overall average of 90 m would delay climate response by 6 years. • Total ocean: mean depth 3800 m. • Would add delay of 230 years if rapidly mixed. In reality, the response depends on rate of ventilation of water through the thermocline (vertical mixing). • Estimate of delay overall is 10 to 100 years. • The ocean currents redistribute heat, fresh water, and dissolved chemicals around the globe.
Trenberth and Caron, J. Clim. 2001 OCEAN-ATMOSPHERE TRANSPORTS The latest best estimate of the partitioning of meridional transports by the atmosphere and ocean.
Heat penetration into land with annual cycle is ~2 m. • Heat capacity of land is much less than water: • Specific heat of land 4½ less than sea water • For moist soil maybe factor of 2 • Land plays lesser role than oceans in storing heat. Consequently: • Surface air temperature changes over land are large and occur much faster than over the oceans. Role of Land • Land has enormous variety of features: topography, soils, vegetation, slopes, water capacity. • Land systems are highly heterogeneous and on small spatial scales. • Changes in soil moisture affect disposition of heat: rise in temperature versus evaporation. • Changes in land and vegetation affect climate through albedo, roughness and evapotranspiration.
Kansas 2001 Irrigation circles: Corn, sorghum green, Wheat gold
The Role of Ice Major ice sheets, e.g., Antarctica and Greenland. Penetration of heat occurs primarily through conduction. The mass involved in changes from year to year is small but important on century time scales. Unlike land, ice melts changes in sea level on longer time-scales. Ice volumes: 28,000,000 km3 water is in ice sheets, ice caps and glaciers. Most is in the Antarctic ice sheet which, if melted, would increase sea level by 65 m, vs Greenland 7 m and the other glaciers and ice caps 0.35 m. In Arctic: sea ice ~ 3-4 m thick Around Antarctic: ~ 1-2 m thick • Ice is bright: reflects the solar radiation ice-albedo feedback • Ice radiation reflected cooler Ice • The West Antarctic Ice Sheet (WAIS) partly grounded below sea level. • Warming could alter grounding of the ice sheet, making it float, and vulnerable to rapid (i.e. centuries) disintegration. • rise in sea level of 4-6 m. • May be irreversible if collapse begins.
Some human-induced environmental changes relevant to climate • Changes in land use (e.g. farming, building cities) • Storage and use of water (dams, reservoirs, irrigation) • Combustion of fossil fuels • Generation of heat • Generation of particulate pollution (e.g., soot, smoke) • Generation of gaseous pollution particulates (e.g., sulfur dioxide, nitrogen dioxide; get oxidized to form sulfate, nitrate) • Generates carbon dioxide • Generation of other greenhouse gases Methane, Nitrous oxide, Chlorofluorocarbons, Ozone Especially via biomass burning, landfills, rice paddies agriculture, animal husbandry, fossil fuel use, leaky fuel lines, and industry Changes the composition of the atmosphere Most important are the gases with long lifetimes Like CO2 > 100 years
The incoming energy from the sun is 342 W m-2: but this is the annual global mean: It amounts to 175 PetaWatts =175,000,000 billion Watts. About 120 PW is absorbed. The biggest power plants in existence are 1000 MegaWatts and we normally think of units of 1 KiloWatt = 1 bar heater; or 100 W = light bulb. • So the energy from the sun is 120 million of these power stations. It shows: • Direct human influences are tiny vs nature. • The main way human activities can affect climate is through interference with the natural flows of energy such as by changing the composition of the atmosphere
The enhanced greenhouse effect • CO2 has increased >33% • If CO2 were suddenly doubled then: • atmosphere must warm up to restore balance • via radiation to space • In absence of other changes: warming is 1.2°C • Feedbacks cause complications • Best estimate is warming of 2.9°C • so feedbacks roughly double change • Real world changes complex and • more gradual
Climate The atmosphere is a “global commons.” Air over one place is typically half way round the world a week later, as shown by manned balloon flights. The atmosphere is a dumping ground for all nations for pollution of all sorts. Some lasts a long time and is shared with all. One consequence is global warming!
Global Warming is happening Since 1970, rise in:Decrease in: • Carbon Dioxide Snow extent • Global temperatures Arctic sea ice • Global SSTs • Global sea level • Tropical SSTs • Water vapor • Rainfall intensity • Precipitation extratropics • Hurricane intensity • Drought
Nonlinear fit Overall warming 0.75ºC Up 0.55ºC since 1970 Variations of the Earth’s surface temperature Annual mean departures from the 1961-90 average for global temperatures, mean 14.0°C, and carbon dioxide concentrations from ice cores and Mauna Loa (1958 on), mean 333.7 ppmv. Updated from Karl and Trenberth 2003.
Heat Waves Impacts on human health and mortality, economic impacts, ecosystem and wildlife impacts
Extremes of temperature are changing! Observed trends (days) per decade for 1951 to 2003 From Alexander et al. (2006)
Europe summer temperatures Exceptional heat wave and drought of 2003 was a major extreme made more likely by global warming: 30K deaths From P. Jones
Sea level is rising: from ocean expansion and melting glaciers • Since 1993 • Global sea level • has risen 37 mm • (1.46 inches) • 60% from • expansion as ocean temperatures rise, • 40% from melting glaciers • Steve Nerem
Controlling Heat Human body: sweats Homes: Evaporative coolers (swamp coolers) Planet Earth: Evaporation (if moisture available) e.g., When sun comes out after showers, the first thing that happens is that the puddles dry up: before temperature increases.
Water Holding Capacity A basic physical law tells us that the water holding capacity of the atmosphere goes up at about 7% per degree Celsius increase in temperature. Observations show that this is happening at the surface and in lower atmosphere: This means more moisture available for storms.
Total column water vapor is increasing: Best estimate of linear trends for global ocean 1.3±0.3% per decade Sig. at >99% Trenberth et al 2005
Global warming Heating Temperature & Evaporation water holding capacity atmospheric moisture greenhouse effect & rain intensity Floods & Droughts
Regions where recent decades heavy precip >> mean precip updated from Groisman et al. (2005a). Precipitation Observed trends (%) per decade for 1951–2003 contribution to total annual from very wet days > 95th %ile. Alexander et al 2006
Evidence for reality of climate change Glaciers melting 1909 Toboggan Glacier Alaska 2000 1858 1974 Grindelwald Glacier Switzerland 1900 2003 Alpine glacier, Austria
Declines in sea ice and snow cover Runoff from earlier snow melt about 1-2 weeks earlier
Surface melt on Greenland Melt descending into a moulin: a vertical shaft carrying water to the base of the ice sheet. Braithwaite Univ. Manchester
SNOW PACK: In many land and mountain areas, global warmingcontributes to: • moreprecipitationfalls asrain rather thansnow, especially in the fall and spring. • snow melt occurs faster and sooner in the spring • snow pack is therefore less as summer arrives • soil moisture is less, and recycling is less • global warmingmeans moredrying and heat stress • the risk ofdrought increases substantially in summer • along with heat waves and wildfires Wildfire, near Denver CO: 2002
Drought: • 3 kinds of drought • Meteorological:absence of rain • Agricultural:absence of soil moisture • Hydrological:absence of water in rivers, lakes and reservoirs
Palmer Drought Severity Index PDSI Dominant pattern: Upward trend. Dai et al 2004 Dry Wet
Rising greenhouse gases are causing climate change and arid areas are becoming drier while wet areas are becoming wetter. Water management:- dealing with how to save in times of excess for times of drought – will be a major challenge in the future.
Context: 400,000 years of Antarctic ice core records of Temperatures, Carbon Dioxide and Methane. Last ice age glacial: 20,000 years ago Source: Hansen, Climatic Change 2005, based on Petit, Nature 1999
CO2 Temp.
Natural forcings do not account for observed 20th century warming after 1970 Meehl et al, 2004: J. Climate.
Climate change & other environmental issues are inter-linked