Kevin E Trenberth NCAR
290 likes | 464 Vues
IPCC. and Climate Assessment. Kevin E Trenberth NCAR. 1988 - The establishment of the IPCC WMO , UNEP 1990 - First IPCC Assessment Report 1992 - IPCC Supplementary Reports 1994 - IPCC Special Report 1995 - Second IPCC Assessment Report 1996 - COP-2, 1997 - COP-3…

Kevin E Trenberth NCAR
E N D
Presentation Transcript
IPCC and Climate Assessment Kevin E Trenberth NCAR
1988 - The establishment of the IPCC WMO, UNEP 1990 - First IPCC Assessment Report 1992 - IPCC Supplementary Reports 1994 - IPCC Special Report 1995 - Second IPCC Assessment Report 1996 - COP-2, 1997 - COP-3… 2001 - Third IPCC Assessment Report 2007 - Fourth IPCC Assessment Report 2007 - Nobel Peace Prize 2009 Dec., COP-15 Copenhagen 2013 – AR5 IPCC 1992- Adoption of the UNFCCC 1994- Entry into force of the UNFCCC Ratified by 189 countries 1997- Adoption of Kyoto Protocol at COP-3 2005 Feb 16- Kyoto Protocol ratified by 164 countries (But not by USA or Australia)
AR5 IPCC (2013) • Chapter 3: Observations: Ocean • Executive Summary • • Changes in ocean interior temperatures and heat budgets • • Ocean salinity change and freshwater budgets • • Sea-level change and extremes • • Ocean biogeochemical changes • • Changes in ocean surface processes • • Changes in ocean circulation • • Decadal variability • Frequently Asked Questions • Chapter 13: Sea Level Change • Executive Summary • • Synthesis of observed sea-level change and its components • • Models for sea-level change • • Projections of globally averaged sea-level rise • • Projections of the regional distribution of sea-level change • • Potential ice-sheet instability and its implications • • Long-term projections • • Extreme sea level events • Frequently Asked Questions
AR5 IPCC (2013) • Ch. 10: Detection and Attribution of Climate Change: from Global to Regional • Executive Summary • • Evaluation of methodologies • • Atmospheric and surface changes • • Changes in ocean properties • • Cryosphere changes • • Extreme events • • Pre-instrumental perspective • • Implications of attribution for projections • Frequently Asked Questions All Natural • Chapter 11: Near-term Climate Change: Projections and Predictability • Executive Summary • • Climate change projections for the next few decades • • Climate predictions and their reliability • • Predictability of decadal climate variations and change • • Regional climate change, variability and extremes • • Atmospheric composition and air quality • • Possible effects of geoengineering • • Quantification of the range of climate change projections • Frequently Asked Questions
New: Decadal forecasting Observed state of ocean required Observed state of ocean required • Initialization: Ocean, sea ice, land processes. • Forward integration of the coupled model: The external forcing by green-house gases is prescribed. • Ensemble generation: to give probabilistic nature • Calibration of model output: Because of deficiencies in the component models the coupled model output needs calibration. • Verification of results and skill assessment: a priori knowledge of the quality of the forecast is required based on past performance:
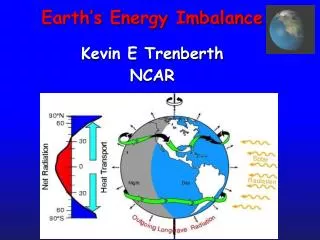
Ocean heat content and sea levelGlobal warming from increasing greenhouse gases creates an imbalance in radiation at the Top-Of-Atmosphere: now order 0.9 W m-2.Where does this heat go? Main sink is ocean: thermosteric sea level rise associated with increasing ocean heat content. Some melts sea ice: no change in SL Some melts land ice. SL increases much more per unit of energy from land-ice melt: ratio about 30 to 90 to 1. Sea-ice melt does not change sea level.
Energy content change 1022 J >90% oceans Figure 5.4 IPCC AR4 1961-2003 (Blue bars) 1993-2003 (Burgundy bars)
Changes in ocean state from 1950-1960’s to 1990-2000’s (IPCC 2007 Figure 5.18)
Revised ocean heat content 0.8 W m-2 0.3 W m-2 Levitus et al 2009 Yearly time series of ocean heat content (1022 J) for the 0-700 m layer from Levitus et al (2009), Domingues et al.(2008) and Ishii and Kimoto (2009) with a base period of 1957-1990. Linear trends for each series for 1969-2007 given in the upper portion of the figure.
Ocean heat content to 700 m Palmer et al OceanObs’09
Ocean heat content 0-2000m OHC 0.77 W m-2 gl ocean 0.54 W m-2 Global Fresh water Sea level and thermosteric OHC Von Schuckmann et al JGR 2009
Ocean heat content 0-2000m SST (red) 2003-2008 – 1990-2008 10 m depth ARIVO – WOA05 Temps Difference for 2003-2008 From WOA05 Levitus et al Von Schuckmann et al JGR 2009
Comments on Von Schuckmann • VS did not provide 0-700 m OHC vs 0 to 2000m • Some floats are programmed to go only to 1000 m and do not go to 2000 m, so that coverage decreases with depth • How come all the error bars are the same even though coverage is increasing? • How good is the quality of the sensors over this time? Up to 30% report negative pressures at the surface.
Ocean heat content is increasing 1. Lyman et al 2010 : to 700m 8. von Schuckmann et al 2009 :to 2000m From Trenberth 2010 Nature
Melting ice • IPCC estimated melting ice contribution to SL rise was 1.2 mm/yr for 1992 to 2003. • How much is missed? • Is the Antarctic and Greenland melt a transient (mainly 2002 to 2006) or not? • Many glaciers are not monitored • Ocean warming may change basal melting: poorly known • Ice sheets, buttressing by ice shelves poorly modeled • Concern future SL rise underestimated • Need process studies and improved models • Changes salinity: fresh water budget • affects ocean currents (MOC)
A. Mean salinity 1951-2000 C. Mean E-P 1980-1993 m3/yr B. Linear trends pss/50yr (top) Durack and Wijffels 2010 JC
Linear trends pss/50yr Durack and Wijffels 2010 JC Subduction appears to account for much of the subsurface changes on isopycnals
What about 2003 to 2008? Global mean surface temperatures 1997 2003 2008
What about post-2003? Several studies: disparate results: Thermosteric sea level rise (mm/yr): Willis et al 2008 JGR: -0.5 ± 0.5 Cazenave et al 2009 GPC: 0.4 ± 0.1 Leulietteand Miller 2009 GRL: 0.8± 0.8 Implication: since 2003, main source of sea level rise is melting of Greenland and Antarctica, and glaciers. These require about a factor of ~50 less heat to produce same sea level rise as ocean expansion If correct, implies reduction in ocean heat uptake and TOA energy imbalance in past 4 years. Does NOT solve energy imbalance problem
Where does energy go? 1020 Joules/yr Trenberth 2009
Can we track energy since 1993 when we have had good sea level measurements? Trenberth and Fasullo Science 2010
Missing energy in CCSM4? CCSM4 future climate simulation (RCP4.5) showing running 10 year trends of surface air temperature In CCSM4, during periods with no sfc T rise, the energy imbalance at TOA remains about 1 W m-2 warming. So where does the heat go?
Missing energy in CCSM4? Taking five ensemble members of RCP4.5 and compositing seven distinct 10-year periods with either zero or slightly negative globally averaged temperature trend shows these time periods are characterized by a negative phase of the Interdecadal Pacific Oscillation (IPO) (the t-test was based on the variance across the 5 year differences in these 7 periods compared to the 5 year differences from the entire run.) Ocean heat content for those two periods shows no warming trend in the upper 275 meters, little trend down to 700 meters, but an ongoing warming trend in the deep ocean; the heat is going into the deep ocean, but where and how? In CCSM4, during periods with no sfc T rise, the energy goes into the deep ocean, somehow.
Annual mean air-sea CO2 flux for 2000 Based on 3 million measurements since 1970 Global flux is 1.4 Pg C/yr Takahashi et al., Deep Sea Res. II, 2009
Global CO2 budget 1850-2006 Human Perturbation of the Global Carbon Budget 2000-2007 fossil fuel emissions 7.5 PgC/y Source deforestation 1.5 CO2 flux (Pg C y-1) atmospheric CO2 4.2 Sink land 2.6 ocean 2.3 Time (y) Canadell et al. (2007) Global Carbon Project (2008)
Summary points • While ocean warming is now clearer from 1970 to 2003 owing to reduced spurious decadal variability, disparate analyses have yet to reach consensus on post 2003. Issues include Argo QC, accounting for missing data, analysis. • Natural variability plays a strong role in regional variations in ocean heat content and salinity . Need full analyses monthly. • Ocean salinities vary mainly from changes in Evaporation minus Precipitation (E-P) and the atmospheric circulation. Ocean observations of salinity complement atmospheric moisture budgets: the ocean as a rain gage • Global warming from increasing greenhouse gases goes mainly into the ocean; some into melting of land and sea ice. Both contribute to sea level rise but using heat to melt land ice contributes about a factor of 50 more. It is essential to balance both sea level and heat budgets. • Land ice and Arctic sea ice are decreasing, and post-2002 evidence suggests accelerated melting of the two major ice sheets of Greenland and Antarctica. Is this acceleration sustained or is it a transient?
Summary points • Melting ice: Many glaciers are not monitored. How much is missed? Ocean warming may change basal melting: poorly known. Ice sheets are buttressed by ice shelves: poorly modeled. Future sea level rise likely underestimated. • Spatial and temporal observations of ocean salinity have not been sufficient, e.g., the Southern Ocean. Issues include instrumental biases, a lack of deep-water salinity data (particularly at high latitudes), insufficient global analyses and incomplete coverage of surface ocean salinities. • Reanalyses of past data are needed to the extent possible. • Temporal sampling issues have been revealed in the overturning transport in the Atlantic at 26.5°N, suggesting that earlier AMOC trends may have been aliased. • The oceans have been a sink for order 30% of the emitted carbon dioxide, thereby increasing acidity with biological impacts. Because solubility decreases as the ocean warms, to what degree will the ocean continue to be a sink for carbon dioxide and what are the implications for marine life? Are there other feedbacks, such as from clathrates becoming unstable? How should these be tracked?
Essential Ocean Observations for IPCC • Sea level: regional and global; daily in storm surges • Ocean carbon: content every few years and the air-sea exchange seasonally; • Ocean biogeochemistry: ocean acidification and effects • Sea surface temperatures: daily, diurnal cycle • Surface currents • Sea surface pressure and air-sea exchanges of heat, momentum: sub-daily • Ocean heat content and transports: sea level, heat capacity, thermal inertia • Fresh water content and transports: global water cycle; thermohaline circulation, abrupt climate change; precipitation and evaporation; • Sea ice extent, concentrations, and thickness: sea level, fresh water, albedo, heat content Needed at least monthly for climate variability including ENSO, climate change, extremes, atmospheric forcings, initial states for coupled model predictions, movement of water, heat, species.