Download
1 / 27
270 likes | 400 Vues
Anticipated and Observed Trends in the Global Hydrological Cycle Kevin E. Trenberth NCAR. Trenberth et al 2008. Controlling Heat. The presence of moisture affects the disposition of incoming solar radiation: Evaporation (drying) versus temperature increase. Human body: sweats

E N D
Anticipated and Observed Trends in the Global Hydrological Cycle Kevin E. Trenberth NCAR
Controlling Heat The presence of moisture affects the disposition of incoming solar radiation: Evaporation (drying) versus temperature increase. Human body: sweats Homes: Evaporative coolers (swamp coolers) Planet Earth: Evaporation (if moisture available) e.g., When sun comes out after showers, the first thing that happens is that the puddles dry up: before temperature increases.
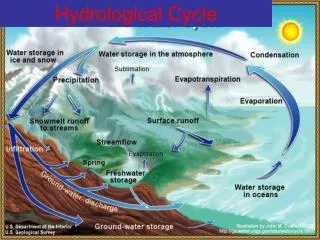
How should rainfall change as climate changes? • Usually only total amount is considered • But most of the time it does not rain • The frequency and duration (how often) • The intensity (the rate when it does rain) • The sequence • The phase: snow or rain The intensity and phase affect how much runs off versus how much soaks into the soils.
Daily Precipitation at 2 stations Monthly Amount 75 mm Amount 75 mm A B Frequency 6.7% Intensity 37.5 mm Frequency 67% Intensity 3.75 mm drought wild fireslocal wilting plantsfloods soil moisture replenished virtually no runoff
Moderate or heavy precipitation: • Can not come from local column. • Can not come from E, unless light precipitation. • Has to come from transport by storm-scale • circulation into storm. • On average, rain producing systems • (e.g., extratropical cyclones; thunderstorms) • reach out and grab moisture from distance about • 3 to 5 times radius of precipitating area.
Changes in precipitation depend a lot on the mean • Precipitation has strong structure with convergence zones • A small shift creates a dipole: big increases some places, big decreases in others • This is the first order effect in El Niño
Observations show that this is happening at the surface and in lower atmosphere: 0.55C since 1970 over global oceans and 4% more water vapor. This means more moisture available for storms and an enhanced greenhouse effect. Total water vapor Air holds more water vapor at higher temperatures A basic physical law tells us that the water holding capacity of the atmosphere goes up at about7% per degree Celsius increase in temperature. (4% per F)
How should precipitation P change as the climate changes? • With increased GHGs: increased surface heating evaporation E and P • With increased aerosols, E and P • Net global effect is small and complex • Warming and T means water vapor as observed • Because precipitation comes from storms gathering up available moisture, rain and snowintensity : widely observed • But this must reduce lifetime and frequency of storms • Longer dry spells Trenberth et al 2003
Heavy precipitation days are increasing even in places where precipitation is decreasing. Precipitation Observed trends (%) per decade for 1951–2003 contribution to total annual from very wet days > 95th %ile. Alexander et al 2006 IPCC AR4
Higher temperatures: heavier precipitation Percent of total seasonal precipitation for stations with 230mm±5mm falling into 10mm daily intervals based on seasonal mean temperature. Blue bar -3˚C to 19˚C, pink bar 19˚C to 29˚C, dark red bar 29˚C to 35˚C, based on 51, 37 and 12 stations. As temperatures and es increase, more precipitation falls in heavy (over 40mm/day) to extreme (over 100mm/day) daily amounts. Karl and Trenberth 2003
How should precipitation P change as the climate changes? • “The rich get richer and the poor get poorer”. More water vapor plus moisture transports from divergence regions (subtropics) to convergence zones. Result: wet areas get wetter, dry areas drier (Neelin, Chou) • “Upped ante” precip decreases on edges of convergence zones as it takes more instability to trigger convection: more intense rains and upward motion but broader downward motion. (Neelin, Chou) • “More bang for the buck”: The moisture and energy transport is a physical constraint, and with increased moisture, the winds can be less to achieve the same transport. Hence the divergent circulation weakens. (Soden, Held, et al)
Increases Decreases Land precipitation is changing significantly over broad areas Smoothed annual anomalies for precipitation (%) over land from 1900 to 2005; other regions are dominated by variability. IPCC
Estimated water year (1 Oct-30 Sep) land precipitation and river discharge into global oceans based on hindcast from output from CLM3 driven by observed forcings calibrated by observed discharge at 925 rivers. Note: 1) effects of Pinatubo; 2) downward trend (contrast to Labat et al (2004) and Gedney et al (2006) owing to more data and improved missing data infilling) Trenberth and Dai 2007; Dai et al. 2008
Flood damages: • Local and national authorities work to prevent floods • (e.g., Corp of Engineers, Bureau of Reclamation, Councils) • Build ditches, culverts, drains, levees • Can backfire! • 2. Deforestation in many countries: • Leads to faster runoff, exacerbates flooding • 3. Increased vulnerability to flooding through • settling in flood plains and coastal regions • Increases losses. • Flooding statistics NOT useful for • determining weather part of flooding!
Drought: • 3 kinds of drought • Meteorological:absence of rain • Agricultural:absence of soil moisture • Hydrological:absence of water in rivers, lakes and reservoirs
Drought is increasing most places Mainly decrease in rain over land in tropics and subtropics, but enhanced by increased atmospheric demand with warming The most important spatial pattern (top) of the monthly Palmer Drought Severity Index (PDSI) for 1900 to 2002. The time series (below) accounts for most of the trend in PDSI. IPCC 2007
Increases in rainfall and cloud counter warming Drought Absence of warming by day coincides with wetter and cloudier conditions Trend in Warm Days 1951-2003 IPCC 2007
Much wetter 1930s: Hot and dry US changes in Precipitation Temperature NCDC
PDSI: severe or extreme drought The warmer conditions suggest that drought would have been much worse if it were not for the much wetter conditions. And it would have been much warmer too! Change in area of PDSI in drought using detrended temperature and precipitation: Red is no trend in precipitation: Would be much more drought! Blue is no trend in temperature. Modest warming has contributed Easterling et al 2007
Mississippi River Basin TRENDS: 1948 to 2004 M is the long-term annual (water-year) mean in mm for water components; W m-2 for energy components b: annual linear trend 1948-2004 mm/century for water W m-2/century for energy (proportional to arrow shaft width). The downward arrow means that the flux increases the trend of dW/dt or G. So it has become cloudier and wetter, with less solar radiation, but with increased ET and diminished SH (change in Bowen ratio). Qian et al 2007
SNOW PACK: In continents and many mountain areas, global warmingcontributes to: • moreprecipitationfalls asrain rather thansnow, especially in the fall and spring. • snow melt occurs faster and sooner in the spring • snow pack is therefore less as summer arrives • soil moisture is less, and recycling is less • global warmingmeans moredrying and heat stress • the risk ofdrought increases substantially in summer • along with heat waves and wildfires Hayman wildfire near Denver 2002: 133 houses burned
“Rich get richer, poor get poorer” Projections: Combined effects of increased precipitation intensity and more dry days contribute to lower soil moisture 2090-2100 IPCC
(Tebaldi , C., J.M. Arblaster, K. Hayhoe, and G.A. Meehl, 2006: Going to the extremes: An intercomparison of model-simulated historical and future changes in extreme events. Clim. Change.)
Climate changes in both rainfall and temperature should be considered together. “It’s not the heat it’s the humidity!” Comfort depends upon both. Water servesas the “air conditioner” of the planet. Water management will be a key issue: How to save excesses in floods for longer dry spells and times of drought? There are prospects for increases in extremes: More floodsand droughts: both have adverse impacts.