Model, Reanalysis D ata and Spectral Nudging
10 likes | 196 Vues
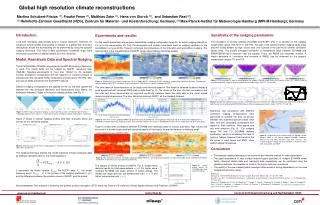
Global high resolution climate reconstructions. Martina Schubert- Frisius (1) , Frauke Feser (1) , Matthias Zahn (1) , Hans von Storch (1) , and Sebastian Rast (2) ,

Model, Reanalysis D ata and Spectral Nudging
E N D
Presentation Transcript
Global high resolutionclimatereconstructions Martina Schubert-Frisius(1), Frauke Feser (1), Matthias Zahn (1), Hans von Storch (1), and Sebastian Rast (2), (1) Helmholtz-Zentrum Geesthacht (HZG), Zentrum für Material - und Küstenforschung; Germany, (2) Max-Planck-Institut für Meteorologie Hamburg (MPI-M Hamburg); Germany Introduction Long-term reanalysis data already exist in coarse resolution. However, for advanced climate studies downscaling is needed. In a global high resolution atmospheric model the downscaling will be performed by using the spectral nudging technique. This kind of data assimilation conserves large scale structures but provides in addition details at a finer resolution. Sensitivityofthenudgingparameters: The correlation of vorticitybetween ECHAM6 and NCEP1 (Fig. 7) is sensitive to the nudging wavenumber range (T42,T21,T11 and T05). The part of the spectrum where nudging takes place become clearly evident by high values near one. Outside of the part much smaller correlation values arise. The zonally averaged correlation of temperature fields between ECHAM6 and ERAINTERIM has a minimum near the equator. There, the RMSE also becomes minimal. A drastic decrease of correlation and increase of RMSE can be observed for the spectral wavenumber ranges T11 and T05. Experiments andresults: For the results presented here we have selected the nudging configuration types N1, av and a nudging strength of 0.5 up to the wavenumber 42. Only the divergence and vorticity have been used as nudging variables for the assimilation run (year 2004). Figure 3 compares the temperature of the simulation with and without nudging. The improvement in the representation of NCEP1 large scales features becomes evident. The time series of the temperature at 2m height and the wind speed at 10m height at selected locations display a good agreement with observed DWD station data (see Fig. 4). The values of the bias, the time correlations and the brier skill score demonstrate an improved conformity between these two data sets in the small scaled meteorological phenomena. The brier skill score employs NCEP1 as the standard hindcast. Figure 5 shows time correlations between ECHAM6 and reanalysis data for various quantities. High values can be found in the extra tropics and less satisfying results in the tropics, where the variance is relatively small. Model, ReanalysisData andSpectralNudging The GCM ECHAM6 (T255L95) developed at the MPI-M Hamburg (Germany) is used. The model fields will be nudged by NCEP1 reanalysis data (T62L28). Selected wavelengths of more than 1000km for the variables vorticity, divergence, temperature and the logarithm of surface pressure is imposed onto the simulated GCM counterparts at levels above 750 hPa. SST and sea ice fields are taken from the NCEP1 data set. Different nudging configurations are applied to find out the best agreement between the new produced reanalysis and observational data: Mainly, we distinguish between 3 types of horizontal nudging profiles (see Fig. 1). Figure 2 shows 3 vertical nudging profiles with their strengths which are chosen for our sensitivity studies. The nudging technique attracts the model trajectory toward reanalysis data by addinga relaxation term to the model equations: X represents the model variable, XNCEP1the NCEP1 data, Fm the model tendency and G (XNCEP1 – X) is the product of the nudging coefficient G (s-1) and the difference between the variable values of NCEP1 and the model. Figure 7: The correlation in spectral space between the nudged ECHAM6 model fields of the vorticity at level 82 (~500hPa) and the corresponding NCEP1 data for different nudging wavenumber ranges (T42,T21,T11 and T05). Figure 3: Temperature at the lowest model level for 31.01.2004, 00UTC. Left panel: NCEP1-reanalysis, middle panel: difference between ECHAM6 with spectral nudging and NCEP1, right panel: difference between ECHAM6 without spectral nudging and NCEP1. Figure 8: Zonally averaged correlation (red lines) and RMSE (blue lines) between the nudged ECHAM6 model fields of the temperature at 850 hPa and the corresponding ERAINTERIM data for different nudging wavenumber ranges (T42,T21,T11 and T05). Numerous test simulations with different combined nudging configurations were performed to achieve the best consensus between the observed typhoons (best track data and their calculated counterparts with regard to their positions, wind speed and sea level pressure (Fig. 9). For nudging range T42 and T21 ECHAM6 delivers satisfactory results in simulating the track of typhoon Tokage. However their trends of the life cycles of wind speed and MSPL show distinct weaker tendencies. Figure 1: Different types for spectral nudging: a) zonal, type N0, b) zonal = meridional, type N1 and c) rhomboidal, type N4. In the figures m, l and n denote zonal, meridional and total wavenumber, respectively. Figure 4: Time series of the nudged ECHAM6 and observed station data (DWD) for 2m temperature (left panel) and 10 m wind speed (middle panel) at Hamburg-Fuhlsbüttel (Germany). Right panel: Bias, time correlation and brier skill score at selected DWD stations for 2m temperature and 10 m wind speed. Figure 9: Comparison of the cyclone tracks for typhoon Tokage (october, 2004) in the various nudged ECHAM6 simulations (T42,T21,T11 and T05) and best track data (crosses). The inserted diagrams display the time evolution of distance to best track, wind speed and MSLP. Figure 2: Different types for the vertical nudging profile: a) vertically constant (echam6 default), b) plateau (dvw) and c) parabel (av). • Conclusion • The spectral nudging technique is an economic and effective method for data assimilation. • The good accordance in near surface meteorological quantities of nudged ECHAM6 model fields, observed station data and reanalysis data respectively can be confirmed using the statistical methods. An exception is found in the tropics with low correlations. • The quality of the new created global reanalysis data reveals a strong dependency on the used nudged wavenumber range. • References: • Kalnayet al.,The NCEP/NCAR 40-year reanalysisproject, Bull. Amer. Meteor. Soc., 77, 437-470, 1996. • Dee DP et. al., 2011: The ERA-Interim reanalysis: configuration and performance of the data assimilation system. Q. J. R. Meteorol. Soc. 137: 553–597. • Stevens, B., Giorgetta, M. A., Esch, M., Mauritsen, T., Crueger, T., Rast, S., Salzmann, M., Schmidt, H., Bader, J., Block, K., Brokopf, R., Fast, I., Kinne, S., Kornblueh, L., Lohmann, U., Pincus, R., Reichler, T., & Roeckner, E. (submitted). The atmosphericcomponentofthe MPI-M Earth System Model: ECHAM6. Figure 5: Time correlations between ECHAM6 nudged and ERAINTERIM for 2m temperature (left panel), for 10m wind (middle panel) and between ECHAM6 and NCEP1 for the daily sums of precipitation (right panel). The spectra of kinetic energy at 500hPa, Fig. 6, reveal nearly identical results for total wavenumbers n ≤ 42. For higher wave-numbers ECHAM6 has larger amount of kinetic energy. The inertial sub-range split into low wavenumber part (~n-5/3) and higher wavenumber part (~n-3). Figure 6: Kinetic energy spectra for ECHAM6 (light blue) and NCEP1(blue). Acknowlegement:This research is funded by the german science foundation (DFG) within the Clustre of Excellence Climate System Analysis and Prediction (CliSAP). www.clisap.de Centrum für Erdsystemforschung und Nachhaltigkeit (CEN) www.cen.uni-hamburg.de


![d ata[0]](https://cdn1.slideserve.com/3300577/slide1-dt.jpg)