SEMAP Technical Project Update: Air Quality Modeling and Future Projections
This SEMAP project update by James Boylan from Georgia EPD highlights significant findings from the 2013 Spring Grants/Planning Meeting. The update covers air quality modeling efforts across Southeast states, focusing on the 2007 baseline modeling, 2018 projections, and diagnostic sensitivities related to ozone and PM2.5 emissions. It emphasizes that SEMAP states currently do not have moderate or serious ozone nonattainment areas and includes insights on emission inventories, modeling performance, and comparisons of air quality projections using various modeling approaches.

SEMAP Technical Project Update: Air Quality Modeling and Future Projections
E N D
Presentation Transcript
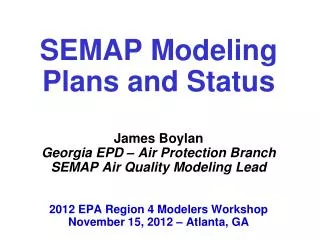
SEMAP Technical Project UpdateJames BoylanGeorgia EPD – Air Protection BranchChair, SEMAP Technical Analysis Work Group2013 Spring Grants/Planning MeetingMay 23, 2013 – Atlanta, GA
SEMAP Project • SouthEastern Modeling, Analysis, and Planning (SEMAP) Project • Managed through SESARM • Same group of states that were involved with SAMI, VISTAS, and ASIP • AL, FL, GA, KY, MS, NC, SC, TN, VA, WV
Outline • 2007 base year modeling • Diagnostic sensitivities • 2018 future year projections • Ozone emission sensitivities • Schedule
Important Notes • SEMAP states do not have any moderate or serious ozone nonattainment areas. All PM2.5 monitors are meeting the 1997 and 2006 NAAQS. • Most likely, none of this modeling will be used in any attainment SIPs. • Modeling will be used to evaluate the relative roles of NOx and VOCs on ozone formation • Modeling might be used to assess interstate transport of ozone and PM2.5 precursor emissions.
2007 Emission Inventory • Emissions Inventory Contractors • AMEC/Alpine Point source (EGU and non-EGU), fire, and on-road mobile (MOVES) emissions. • TranSystems Area and non-road (including MAR) emissions. • “Actual” Emission Inventory (2007) • Used for model performance evaluations • “Typical” Emission Inventory (2006-2008) • Fires only (not EGUs) • Used for relative reduction factor calculations
Air Quality Modeling System Meteorology (WRF) Air Quality (CMAQ) Emissions (SMOKE) Emissions Inventory (NIF) MOVES Rates
2007 Air Quality Modeling • GT/UNC - SESARM contractor • 2007 annual modeling with CMAQv5.0 • 36 and 12 km grids • Model performance evaluation • Diagnostic sensitivity testing (only if MPE poor) • New CMAQv5.0 Model Options • Additional new crustal species YES • In-line plume rise for point sources YES • In-line lightning NOx YES • In-line bi-directional NH3 flux NO • In-line biogenic emissions NO • In-line wind blown dust NO
Ozone Model Performance • Performance goals (Tesche, 1990) • Normalized mean bias (NMB) less than +15% • Normalized mean error (NME) less than 30-35% • Form of ozone concentrations • 1-hr ozone (w/ 60 ppb cut-off) • 8-hr max. ozone (w/ 60 ppb cut-off) • Spatial and temporal resolution • Individual monitors • Monthly average
PM2.5 Model Performance • Performance goals and criteria (Boylan & Russell, 2006) • GOAL: Mean fractional bias (MFB) less than +30% • GOAL: Mean fractional error (MFE) less than 50% • CRITERIA:MFB less than +60% • CRITERIA:MFE less than 75% • Form of PM2.5concentrations • 24-hour average total PM2.5 and major species • Spatial and temporal resolution • Individual monitors • Monthly average
Diagnostic Sensitivities • Increased minimum PBL height • Updated mixing coefficients • Reduced boundary conditions • Removed lightning NOxemissions • Reduced ground-level NOxemissions • Updated land-water interface
Revised CMAQ Run • Increased minimum PBL height • Updated mixing coefficients • Reduced boundary conditions • Removed lightning NOxemissions • Reduced ground-level NOxemissions • Updated land-water interface • Corrections were made to locations of point sources (all states) and updated point PM2.5 emissions in GA, TN, and WV.
8-Hour Ozone NMB - August BEFORE AFTER
2018 Projections • 2018 Emission Inventory • Growth and control factors for EGU point, non-EGU point, area, and MAR • Rerun NONROAD • Inventory mode ratio method for MOVES • 2018 Emissions Modeling • SMOKE for most source sectors • MOVES: Ratio approach using Inventory Mode • 2018 CMAQ Modeling • Projections of ozone, PM2.5, and regional haze • Follow EPA’s RRF approach
EGU Projection Tools • SEMAP (2018) • Simple linear growth and control factor application • AEO2012 growth factor • Control data supplied by SESARM states • No explicit consideration for energy demand among units • ERTAC (2017, 2018, 2020) • Heat input/generation projection with controls • AEO2013 draft growth factor • Control data supplied by states • Explicit energy demand among units in the same fuel type • IPM (2020) • Considers complex economic interactions among energy sector
FY Emission Comparisons • Comparison of SO2 and NOx emissions • SEMAP (2018) – DRAFT!! • ERTAC (2017, 2018, 2020) – DRAFT!! • IPM (2020) – EPA’s PM2.5 NAAQS analysis • Initial comparison performed for Georgia EGUs • Still investigating differences between SEMAP, ERTAC, and IPM projections.
FY SO2 Emissions in GA (total) Log Scale Generic Units
FY SO2 Emissions in GA (facility) IPM assigned generation capacity to coal facilities that are shutting down (using outdated NEEDS database).
FY SO2 Emissions in GA (by unit) IPM predicted much higher SO2 emissions from big coal units compared to ERTAC and SEMAP.
FY NOx Emissions in GA (total) Log Scale
FY NOx Emissions in GA (facility) IPM assigned generation capacity to coal facilities that are shutting down (using outdated NEEDS database).
FY NOx Emissions in GA (unit) SEMAP assigned higher NOx emissions for certain facilities. SEMAP assigned lower NOx emissions for certain facilities.
Previous Ozone Sensitivities 4 11 23 6 6 Red numbers indicate number of days used in RRF calculations
New Ozone Sensitivities • Use 2018 modeling platform • Perform emission sensitivity runs • Ozone season (5 months) at 12-km • Statewide 30% emission reductions • NOx • VOCs • Fourteen Geographic Regions • Ten SEMAP states • Maryland • MANE-VU, LADCO, CenRAP • 2 precursors x 14 regions = 28 model runs
Contact Information Jim Boylan, Ph.D.Georgia Dept. of Natural Resources4244 International Parkway, Suite 120Atlanta, GA 30354James.Boylan@dnr.state.ga.us 404-362-4851