Download
1 / 61
610 likes | 736 Vues
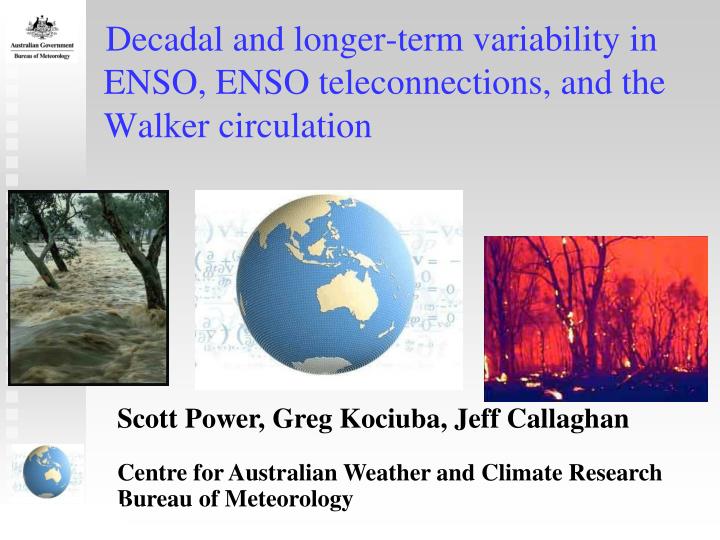
Decadal and longer-term variability in ENSO, ENSO teleconnections, and the Walker circulation. Scott Power, Greg Kociuba, Jeff Callaghan Centre for Australian Weather and Climate Research Bureau of Meteorology. Contents.

E N D
Decadal and longer-term variability in ENSO, ENSO teleconnections, and the Walker circulation Scott Power, Greg Kociuba, Jeff Callaghan Centre for Australian Weather and Climate Research Bureau of Meteorology
Contents • Decadal – interdecadal changes in ENSO and ENSO teleconnections • A simple model for decadal variability in ENSO and “ENSO-related” patterns of variability • An inadequacy of this model =>ENSO-driven multi-year variability =>Multi-year predictability • Anthropogenic changes in the Walker circulation and the SOI
The SOI – a product of French Australian cooperation! • One of the world’s most important climatic indices • Used extensively to estimate and predict changes linked to ENSO and changes in the Walker circulation (e.g. in rainfall, agricultural production, disease, streamflow, …) • If SOI < 0 = > weaker Walker circulation
Innisfail 1918 3500 residents, only 12 houses remained intact Approximately 75-100 deaths
A new homogeneous tropical cyclone data base for north-eastern Australia • Taken over a decade to develop • Extensive primary sources of information: • Longest (non-palaeo) record in SH [1872/73-2009/10] • homogeneous Callaghan and Power, 2010: Variability and decline in tropical cyclones making land-fall over eastern Australia since the late 19th century. Climate Dynamics.
Delayed-Action Oscillator (DAO) dT(t) /dt = aT (t) - bT ( t - d) • T = SOI or east Pacific SST; a, b >0; d=time delay Analytic solutions to the DAO Equation (Power 2010)with T(t) = T0 eat, t ≤ 0 : t > 0 Cf. numerical solutions of Battisti and Hirst (1989)
Simple model for DV(ENSO) Fitting DAO to SOI: dT/dt = aT-bT(t-d) + Noise d=7mo, a=0.13/yr, b=1.4/yr • Noise-driven damped oscillation with period =3.8 yr, decay time (e-folding scale) = 0.9 yr dT/dt(t) - bT ( t - d) + Noise or d2T/dt2 = -σ02T + 2σRdT/dt+ Noise cf. Thompson and Battisti (2000), Jin (1997), Meinen and McPhaden (2000) Noise has decadal/interdecadal tail so stochastic forcing drives some of the decadal variability in ENSO (even if ENSO is partially self-sustained)
“The relationship between ENSO and Australian climate in both the model and the observations is strong in some decades, but weak in others. A series of decadal-long perturbation experiments are used to show that if these interdecadal changes are predictable, then the level of predictability is low”. J. Climate, 2006
Suppose ELF is a low pass filtered ENSO index, e.g.: 1m ELF = ------------ Σ E t-k., and r(E, SST)= α. m+1k=0 < ELF, SSTLF> Then r(ELF, SSTLF) = ________________________ . (1) √ [ < ELF, ELF > <SSTLF, SSTLF> ] Now < ELF, ELF > = < Et, Et + Et-1 + Et-2 + Et-3 + … + Et-m> / (m+1)2 + < Et-1, Et + Et-1 + Et-2 + Et-3 + … Et-m> / (m+1)2 + … + < Et-m, Et + Et-1 + Et-2 + Et-3 + … Et-m>/ (m+1)2 = (m+1)/(m+1)2=1 / (m+1), (2) where we have used the fact that E is white noise. Similarly < SSTLF, SSTLF > = 1/(m+1), so (3) < SSTLF, ELF > = < SSTt, Et + Et-1 + Et-2 + …+ Et-m>/ (m+1)2 + < SSTt-1, Et + Et-1 + Et-2 + … Et-m> / (m+1)2 + … + < SSTt-m, Et + Et-1 + Et-2 + … Et-m>/ (m+1)2 = (m+1) < SSTt, Et >/ (m+1)2 = α/ (m+1). (4) Using (2)-(4) in (1) then gives r(ELF, SSTLF) = α. Power and Colman, 2006: Climate Dynamics
Decadal pattern much broader => Different physics in off-equatorial “wings” c.f. Zhang et al. 1998; Mantua et al. 1997; Power et al. 1999; Power and Colman 2006
Off-equatorial sub-surface variability is a low pass filtered version of ENSO variability Decadal-long Perturbation Experiments Discovery: Sub-surface ENSO-driven off-equatorial decadal variability is highly predictable Low pass filtering due to dominance of low frequency oceanic Rossby waves in response to ENSO wind-stresses 13 years Power and Colman, Climate Dynamics, 2006; cf. Newman et al. 2002
Conclusions so far • Large and important decadal – interdecadal changes in ENSO and ENSO indicators have been observed and modelled • A simple model for decadal variability in ENSO and ENSO-like patterns of variability was presented • While useful in capturing some of the variability, the simple model is inadequate because ocean acts as LPF on ENSO forcing • This yields e.g. ENSO-driven multi-year predictability in off-equatorial wings
Other evidence for more sophisticated physics • Kirtman and Scopf (1998) • Kleeman et al. (1999) • Wang et al. (20xx) • McGregor et al. (2008) • …
Anthropogenic changes in the Walker circulation and the SOI 4.
Power and Kociuba, Climate Dynamics, 2010 (submitted); see also Vecchi et al. (2006); Meehl et al. (2007)
The Walker circulation weakens in response to global warming(Vecchi et al. 2006; Meehl et al. 2007 /IPCC AR5;Power and Kociuba 2010)“This obviously means that the SOI also declines in response to global warming”“So part of observed decline in SOI due to global warming”
The Walker circulation weakens in response to global warmingThe SOI does not decline in response to global warming. The large observed decline in the SOI is therefore natural. Power & Kociuba, Climate Dynamics (submitted), 2010
We can therefore infer (taking models at face value) that: • Observed weakening of Walker circulation over 20th century due to both natural variability and external forcing Supports conclusions of Meehl et al. 2009
Future work (for dessert*) • Further clarify causes and relative importance of decadal variability in ENSO activity • Important that simulation of ENSO in CGCMs becomes more realistic * wine earned by providing numerous references during talk
The End – thank you for listening! Scott Power Centre for Australian Weather and Climate Research Bureau of Meteorology
Impact of global warming on the SOI • SOI used extensively to estimate and predict changes linked to ENSO and changes in the Walker circulation (rainfall, streamflow, disease, tropical cyclones, …) • Correlation coefficient between SOI and equatorial MSLP pressure gradient (ΔP) = 0.83 • ΔP = BoxE(5˚S-5˚N, 200˚E-280˚E) - BoxW(5˚S–5˚N, 80˚E–160˚E) El Niño, weaker Walker circulation, SOI < 0
Summary • There has been pronounced interdecadal variability in the Walker circulation during the 20th century and an overall weakening of the Walker circulation in recent decades. • Weakening due to both global warming and natural variability. • Global warming weakens Walker circulation but (surprisingly) increases SOI. The SOI is not a good guide to changes in Walker circulation forced by global warming. • Observed decline in SOI natural and largely due to a natural increase in dominance of El Niño over La Niña activity.
Power (2010), Theoret. Appl. Climatol.; cf. numerical sols of Battisti and Hirst (1987)
Contents • Australian tropical cyclones: interannual-decadal variability, and long-term trends and links to ENSO and the SPCZ • Interdecadal variability and trends in the Walker circulation, ENSO activity, and the Southern Oscillation Index • Predictability of ENSO teleconnections, origin of decadal ENSO-like patterns
Wind-stress forced shallow water model and simplified coupled models Off-equatorial region forcing Equatorial region forcing Off-equatorial region forcing McGregor et al., 2007
First EOFs from Wind-forced Shallow Water Model Forcing applied everywhere Off-equatorial forcing only McGregor, Holbrook and Power, 2007; see also Wang et al. 2003, Part 1 – “wind-stress in eastern tropical & subtropical basin most effective in driving this kind of zonal equatorial response (from theory and wind-forced SWM)
Summary • DCV in El Niño-Southern Oscillation is an important part of DCV in the Pacific • Randomness seems to explain a lot • Nevertheless predictability is evident • as ENSO-modified red noise • equatorial variability driven by off-equatorial wind-stresses • ENSO-driven decadal climate variability in sub-surface ocean • …
dT/dt = -aT + bE + cN Power and Colman, Climate Dynamics, 2006; see also Newman et al. 2007 for similar behaviour in PDO Index
Newspaper archives • Brisbane Courier Mail held at the Queensland State Library • Maryborough Chronicle researched by the Hervey Bay City Council • Townsville Historical Society • Mackay Mercury • Cairns Post • Rockhampton Morning Bulletin • Cairns Historical Society • Archives of various newspapers held by the Bureau of Meteorology, Brisbane
Interannual variability in the SOI is an excellent proxy for interannual variability in ΔPequator and the Walker circulation: • SOI > 0 => La Niña • SOI < 0 => El Niño • But under global warming ΔPequator decreases whereas the SOI increases
Paths of cyclones in El Nino (top) vs La Nina (bottom) years
Non-linear impact of ENSO on southwest USA/Mexico? Power et al. 2006
Summary so far • ENSO teleconnections to Australia vary substantially from generation-to-generation • This variability seems to have very little predictability • The changes are in phase with IPO/PDO because of non-linearity in the ENSO teleconnection to Australia • This gives interesting effects that seem to point to decadal predictability but this is not necessarily the case • Non-linear teleconnections may exist elsewhere • The IPO and PDO have strong links • Discussion of PDO emphasizes North Pacific