Sky-Plane Probability Distribution for Impactors: Insights from the PS1 Survey
This document summarizes findings from the PS1 survey on the sky-plane probability distribution for small impactors, particularly focusing on the analysis of 2008 TC3 and 3-meter diameter bolides. It discusses methodologies for tracking impactors with notable apparent motion characteristics, the likelihood of encountering small impactors, and provides insights into the effectiveness of the telescopes and systems used. The report underscores the importance of observational data and the potential for undiscovered small asteroid populations, emphasizing improvements in detection capabilities.


Sky-Plane Probability Distribution for Impactors: Insights from the PS1 Survey
E N D
Presentation Transcript
Previously, at Bolides 2009 Prague...
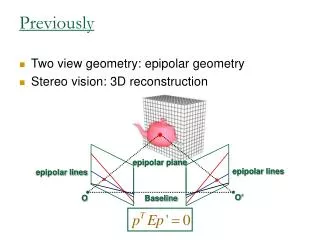
Sky-plane probability distribution for impactors 30 days before impact with V < 22.7 and apparent motion < 12 deg/day Vereset al. (2009)
Sky-plane probability distribution for 3 meterdiameter impactors(bolides) 1 day before impact 2008 TC3 with V < 22.7 and apparent motion < 12 deg/day Vereset al. (2009)
impactor discoveries in a4 year PS1 survey mission Vereset al. (2009) 1 night tracklet 3 night orbit
impactor discoveries in a4 year PS1 survey mission Vereset al. (2009) So how did CSS find 2008 TC3? • they got ‘lucky’ or • there are more small impactors than expected or • something is wrong with our simulation 1 night tracklet 3 night orbit
A • John Tonry, PI • 8 telescopes and cameras • 25cm aperture, f/2.8, 5° FOV, 20 deg2 • 4x4k pixels at 4.4”/pix • 30s exp, 4s readout, 10e- read-noise • Sensitivity at SNR=5 • V=19.3 1 telescope, 1 exp, red & blue • V=20.0 4 telescope, 4 exp, red & blue • Deployment • 2 pairs x 2 pointingsx 2 sites • “blue” (g+r) and “red” (r+i) filters • 2 observations of 20,000 deg2/night STEROID T ERRESTRIALIMPACT L AST A LERT S YSTEM
A STEROID T ERRESTRIALIMPACT L AST A LERT S YSTEM
A STEROID T ERRESTRIALIMPACT L AST A LERT S YSTEM
A Ironwood Observatory STEROID T ERRESTRIALIMPACT L AST A • portable • robotic • autonomous LERT S YSTEM
A • Cost • ≈ $2M construction for 2 sites • ≈ $0.5M/year operations • ≈ $1Mincremental/site • Time • 2 years from start of funding STEROID T ERRESTRIALIMPACT L AST A LERT S YSTEM
A • Asteroid collisions • 10m MB asteroid disruption/day • 100m MB asteroid disruption/year • 1000m dust cloud visible in MB • Light curves • ~400 photometric observations/yearfor ~105asteroids • Bolides • Onebolide like 2008 TC3 per year STEROID T ERRESTRIALIMPACT L AST A LERT S YSTEM
A T L ATLASwill identify>60% of allimpactors A S
A STEROID T ERRESTRIALIMPACT L AST A LERT S YSTEM