Download
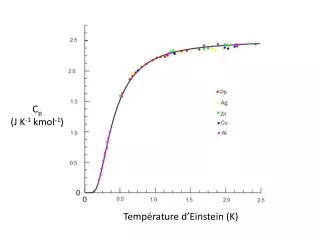
1 / 14
140 likes | 248 Vues
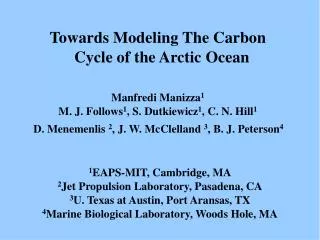
Towards Modeling The Carbon Cycle of the Arctic Ocean. Manfredi Manizza 1 M. J. Follows 1 , S. Dutkiewicz 1 , C. N. Hill 1. D. Menemenlis 2 , J. W. McClelland 3 , B. J. Peterson 4. 1 EAPS-MIT, Cambridge, MA 2 Jet Propulsion Laboratory, Pasadena, CA 3 U. Texas at Austin, Port Aransas, TX

E N D
Towards Modeling The Carbon Cycle of the Arctic Ocean Manfredi Manizza1 M. J. Follows1, S. Dutkiewicz1, C. N. Hill1 D. Menemenlis 2, J. W. McClelland 3, B. J. Peterson4 1EAPS-MIT, Cambridge, MA 2Jet Propulsion Laboratory, Pasadena, CA 3U. Texas at Austin, Port Aransas, TX 4Marine Biological Laboratory, Woods Hole, MA
TALK OUTLINE 1) The Arctic Ocean Carbon Cycle (AOCC) 2) A role for riverine DOC in the AOCC 3) Transport, Fate & Lifetime of riverine DOC in the Arctic Ocean: Model-Data comparison. 4) Conclusions
Arctic Ocean Carbon Cycle ATMOSPHERE Land Biosphere CO2 Sea Ice Rivers DOC Primary Production = 0.4 PgC yr-1 Coast Phytoplankton Riverine DOC flux = 0.25 PgC yr-1 CO2 Fluxes Shelf Surface Ocean ORGANIC CARBON EXPORT Deep Ocean
Approach of “Data-Model Fusion” 1) Realistic riverine DOC flux from land to ocean. 2) Realistic representation of Large Scale Ocean Circulation in the Arctic basin. 3) Proper time scale regulating the rate of decay for riverine DOC while in the ocean .
1- Riverine Discharge of DOC in the Arctic Runoff Climatology DOC data from Townsend McClelland Peterson 3754 Hydro-stations From Lammers et al., JGR 2001
Pan-Arctic DOC Riverine Flux 3.5 Large seasonal Cycle of River RunOff peaking in June 1011molC month-1 0 Time (months) Eurasian Load > North-American Load
Regional Arctic Set-up of MITgcm 1 - Regional version of MITgcm (cubed sphere) for the Arctic domain with open boundary conditions. 2 - Eddy-resolving (~20 Km), using 1992-2001 NCEP Atmospheric Forcing - 3 repeated simulated decades. 3 - ON-LINE version of MITgcm for tracer transport and marine biogeochemical processes (carbon cycle). 4 - This study: ARCTICOCEANCIRCULATION and PASSIVE & DECAYING TRACER simulating transport and fate of riverine DOC.
2) - Large Scale Circulation of the Arctic Ocean 38 24 Slide 9 Surface flow (0-200 m) Regional Arctic MITgcm Surface Salinity & Surface velocity (Figure from Rudels, 2006)
Riverine Fluxes & Ocean Dynamics 30th simulated year - annual mean 1) Atlantic Waters : Low [TRC] 100 Western Arctic (WA) MacKenzie 2) EA Coastal Waters : High [TRC] Greenland 3) Pacific Waters : Low [TRC] 4) WA Coastal Waters : High [TRC] Eastern Arctic (EA) (I) Evident link between : Location of riverine tracer fluxes Ocean circulation patterns 0 [Passive Tracer] & Surface velocity (Units : microM) (II) Strong haline gradients set the differences in both water masses and [trc] distributions
Cross-Shelf Transport, Mixing, and Decay of DOC Coastal Waters (Higher DOC & Lower Salinity) DOC (decaying tracer) Mixing Line Open-Ocean Waters (Lower DOC & Higher Salinity ) Salinity (passive tracer) Hansell et al. 2004 can impact mixing line. = Decay time scale of Tracer Black Dots = Western Arctic White Dots = Eastern Arctic Salinity
Data-Model Comparison (I) = 0 500 Without any decay Tracer values too high !! 250 With 5 years decay Lower Tracer values BUT values OFFSET 0 = 5 years 500 Eastern Arctic Western Arctic 250 0
Data-Model Comparison (II) DOCtotal = DOCriver+ DOCin-situ DOCin-situ ~ 50 microM (Anderson , 2002) 500 Eastern Arctic Western Arctic 250 0 Manizza et al., in prep
CONCLUSIONS 1 - Regional Ocean Model (MITgcm) captures main ocean circulation features and water masses distribution in the Arctic Ocean. 2 - Model-data fusion is a robust approach and it’s reliable as benchmark for testing data-based hypotheses. 3 -This study will help to constrain the carbon transfer for DOC to DIC pool to correctly estimate air-sea CO2 fluxesat basin scale.
Assessing Lifetime of Riverine DOC Passive Tracer ∂C/∂t = Adv. + Diff. Circulation Only Circulation + Decay Decaying Tracer ∂C/∂t = Adv. + Diff. - C C = Idealized Tracer = 1/ = Decay Time Scale = 1 - 10 years (5 years example)

![>> W1=[1 1 1 1;1 -j -1 j;1 -1 1 -1;1 j -1 -j] W1 =](https://cdn1.slideserve.com/3227081/slide1-dt.jpg)