Download
1 / 24
240 likes | 321 Vues
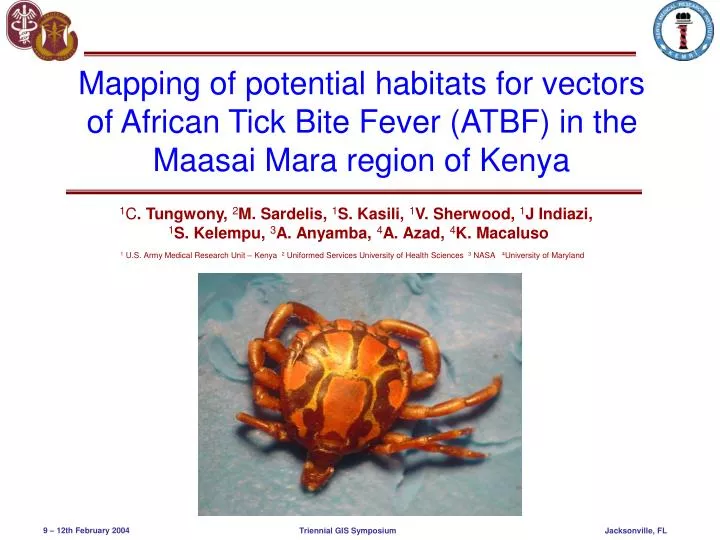
Mapping of potential habitats for vectors of African Tick Bite Fever (ATBF) in the Maasai Mara region of Kenya. 1 C . Tungwony, 2 M. Sardelis, 1 S. Kasili, 1 V. Sherwood, 1 J Indiazi, 1 S. Kelempu, 3 A. Anyamba, 4 A. Azad, 4 K. Macaluso.

E N D
Mapping of potential habitats for vectors of African Tick Bite Fever (ATBF) in the Maasai Mara region of Kenya 1C. Tungwony, 2M. Sardelis, 1S. Kasili, 1V. Sherwood, 1J Indiazi, 1S. Kelempu, 3A. Anyamba, 4A. Azad, 4K. Macaluso 1U.S. Army Medical Research Unit – Kenya 2 Uniformed Services University of Health Sciences 3 NASA 4University of Maryland Triennial GIS Symposium
Introduction • African Tick Bite Fever (ATBF) is a spotted fever caused by Rickettsiae africae and vectored by ticks • Rickettsiae africae was first reported in ticks in Maasai Mara, in 2003, following fatal tourist case • Maasai Mara is a national game reserve and popular tourist destination • Maasai Mara is characterized by diverse vegetation • GIS employed to help identify prevalent tick habitat Triennial GIS Symposium
Maasai Mara National Game Reserve Study Area: People and Vegetation • The Maasai Mara Game Reserve and • adjacent Conservation area totals • 750 square miles • It is 2000m (5,200 ft)above the sea level • Inhabited by the Maasai community • (livestock keepers) • It is characterized by shrubby grassland and riverine forest Triennial GIS Symposium
Study Area: Rainfall and Temperature Triennial GIS Symposium
Tick Collection • Six Different vegetation types selected for tick collection • 50 collection sites • GPS recorded locations of each collection site • Three collections: April, September, December (2002) • Collection methods: drags and picking off animals Triennial GIS Symposium
Apr 2002 Sept 2002 Vegetation Classification – 3 Steps 1. LANDSAT images (Enhanced Thematic Mapper, Satellite 7) from USGS Triennial GIS Symposium
Vegetation Classification – 3 Steps 2. Image processing - Export to Idrisi 32 - Georeference - Subset - Natural Color composite - Overlay GPS points April Triennial GIS Symposium
Vegetation Classification – 3 Steps 3. Supervised Classification (Maximum Likelihood) used to identify land cover types April September Triennial GIS Symposium
Vegetation Classification – 3 Steps 3. Supervised Classification (Maximum Likelihood) used to identify land cover types April September Triennial GIS Symposium
Vegetation Classes Triennial GIS Symposium
Vegetation Classes Triennial GIS Symposium
Results: April Triennial GIS Symposium
Results: September Triennial GIS Symposium
Results: December Triennial GIS Symposium
Results: Combined Triennial GIS Symposium
Summary Summary of locations and life stages. • Ticks collected in all habitat types except Grazed grass • For habitats positive for ticks larvae was • likely to be Encountered in other habitats. • Adult ticks were only collected in December • and were Observed at all other habitats. • Fewer Nymphs were collected compared to • Larvae in all habitats Triennial GIS Symposium
Density: Cattle, Goat and Sheep Triennial GIS Symposium
Vegetation Index April September • High index values characterizes dense vegetation Triennial GIS Symposium
Conclusion • GIS can help visualize risk areas and, with identification of tick populations, map areas for control programs • Identify spatial and temporal relationships important in disease • transmission • Model risk of contracting vector borne diseases • The study has indicated that this area is rich ground for further studies of ATBF Triennial GIS Symposium
References • Tanser, F.C; and Le Sueur, D. (2002) The application of geographical information systems to important public health problems in Africa. International journal of health geographics. Available from; http://www.ij-healthgeographics.com/content/1/1/4 • Lobitz, B. et al (1999) Climate and Infectious diseases: Use of remote sensing for detection of vibrio cholerae by indirect measurement. John Hopkins University • Anno, S. et al (2000) Analysis of relationship between Anopheles subpictus larval densities and environmental parameters using remote sensing (RS), a global positioning system (GPS) and geographic information system (GIS). Kobe J. Med. Sci. 46, 231/243. • Macaluso, K.R. et al (2003) Spotted Fever Group Rickettsiae in ticks from the Maasai Mara Region of Kenya. The society of Tropical Medicine and Hygiene. Am J. Trop. Med. Hyg., 68(5), 2003, PP. 551-553 • Rutherford, S.J. et al (2002) Spotted fever rickettsioses in Kenya (un published data) Triennial GIS Symposium
Acknowledgements • Kenya Medical Research Institute • Mara Safari Club • Kenya Meteorological Department • International Livestock Research Institute • U.S. Geological Survey • Assaf Anyamba & Ed: GSFC - NASA Triennial GIS Symposium


![>> W1=[1 1 1 1;1 -j -1 j;1 -1 1 -1;1 j -1 -j] W1 =](https://cdn1.slideserve.com/3227081/slide1-dt.jpg)