Download
1 / 12
140 likes | 263 Vues
This piece explores our profound relationship with plastic, particularly focusing on the statistics and efforts from Ohio Wesleyan University (OWU) to combat plastic pollution. It highlights alarming trends, such as the production of more plastic in the 2000s than in the entirety of the 20th century, and the detrimental effects of microplastics on marine ecosystems. The OWU statistics provide insights into local waste production and the university's initiatives to foster a more sustainable lifestyle. Join us in understanding and addressing our reliance on plastic.

E N D
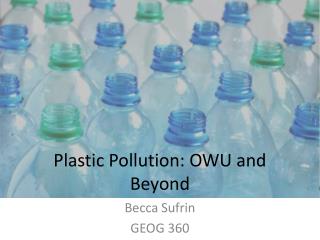
Plastic Pollution: OWU and Beyond Becca Sufrin GEOG 360
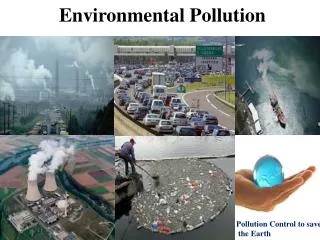
Our relationship with plastic is deeply embedded within our lifestyles.
The OWU Statistics • HamWil • 2 out of 9 • 0 out of 2 • Beeghly Library • 1 out of 7 • 3 out of 6 • 1 out of 1 • Senior Housing • 4 out of 12 • 5 out of 14 • 6 out of 13
Production of the Plastic Bottle The Life Cycle of a Water Bottle =
Reliance and dependence on wasteful lifestyles is perhaps the most difficult pattern to break.
What we don’t see we don’t care about. • “In the first decade of this century (2000 – 2010) we produced more plastic than all other plastic in history up to the year 2000.”
Nurdles “As microplastics and other trash collect on the surface of the ocean, they block sunlight from reaching plankton and algae below. Algae and plankton are the most common autotrophs in the marine food web. Autotrophs are organisms that can produce their own nutrients from oxygen, carbon, and sunlight. If algae and plankton communities are threatened, the entire food web may change.” PLASTICIZED – PART 1
Saved Bottles: • HamWil– averages around 1250 per month • Other stations – range from 400 – 800 depending on location Cost: • $80 filter replacement after approximately 3,000 gallons used