Download
1 / 55
550 likes | 747 Vues
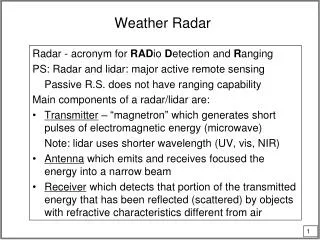
Radar Detection of Shallow Weather and Orographic Phenomena. Paul Joe EUMETCAL Weather Radar 20130605. Who am I? a research scientist specializing in developing applications (severe weather, aviation, quantitative precipitation). I work for Environment Canada and live in Toronto.

E N D
Radar Detection of Shallow Weather and Orographic Phenomena Paul Joe EUMETCAL Weather Radar 20130605
Who am I? • a research scientist specializing in developing applications (severe weather, aviation, quantitative precipitation). • I work for Environment Canada and live in Toronto. • the chair of the WMO/Working Group on Nowcasting Research and have had a lot fun demonstrating the use of radar for nowcasting at the Sydney (2000), Beijing (2008), Vancouver (2010) and Sochi (2014) Olympics. • contribute to several Expert Teams in the WMO/Commission of Instruments, Methods and Observations (Upper Air and Remote Sensing and Surface Observations). Beijing Vancouver Sochi Photography Skiing
Module Objective This module briefly explores “radar meteorological” issues of low level weather detection in a generic way.
Outline • Some “radar calculations”: • Typical reflectivities of rain, drizzle, fog, snow (detection issue) • Beam height (detection issue) • Beam width (quantitative and detection issues) • Sensitivity (detection issue) • Impact on Meteorology • Drizzle • Lake Effect Snow • Clear Air Echoes • Orographic Precipitation
Low Level Phenomena Detectable by Radar • Meteorological Targets • Precipitation (Drizzle, Rain, Snow, Hail) • Lake Breezes, Convergence Lines, Gust fronts, cold pools • Biological Targets (example at the end) • Insects, birds, bats • Electro-magnetic Targets (examples) • Other radars, RLANs, Sun, second trip echoes • Other (not discussed) • Building, Mountains, Forests • For calibration of humidity retrieval • Turbulence (Bragg scattering) • Hard Targets (not discussed here) • Wind turbines, Cars, ships, space debris • Forest fires • Sea Clutter Romanian Gust Front
General Comments – Low Scanning • Wide variety of phenomena and intensity of targets • Turbulence (too weak) to Mountains (very intense) • From very weak to very strong (-30 dBZ to 95 dBZ) • Different Doppler signatures • Some have 0 velocity • Some have aliased velocity (> Nyquist) • Advanced uses of weather radar • VDRAS – variational doppler radar assimilation system • Refractivity retrieval – use of ground clutter echoes • Commonality • Limited range! • Low echo strength (generally), • Low height of weather, • Radar sensitivity and scanning are issues
Drizzle Some Radar Examples
Germany Example 1 Drizzle in surface observations BUT NO/Little RADAR DATA Drizzle reported in surface observations but no radar echoes. Lang, DWD
Germany Example 2 Drizzle (mm/h) but very few echoes Lang, DWD
Drizzle in Finland! • Why was drizzle observed in Finland but not Germany? • Why is the drizzle observed only around the radar? • Why is the reflectivity pattern stronger near the radar and decreases away from the radar? • Why is there a range limit to see drizzle? Saltikoff, FMI
Minimum Detectable Signal Concept
Color is Probability Distribution of Reflectivity with Range (not important for this discussion). Function of Wx. The Radar Equation P = C Z r2 Minimum Detectable Signal (constant power) MDS can expressed as a noise temperature or a power measurement but for meteorologists it more useful to express as reflectivity at a particular range. Typically, -1 dBZ at 50 km. Minimum Detectable SignalThe detection threshold (as a function of range). Reflectivity [dBZ] Range [km]
Reflectivity Factor - Linear Some Radar Considerations P = C Z r2 P = power, C = radar constant, r = range Z = N D6 [Z] = mm6/m-3 dBZ = 10 log Z
Power Range Reflectivy Range Radar Equation and MDSPmin = C Zmin(r) r2 • The Radar measures “P” – power received • The Radar Equation converts P to Z for a given range (r) • Radar Equation accounts for expanding beam with range (1 /r2) • Sensitivity (or MDS) is a certain power level • Just above the noise (hsssssss) level • In terms of P (power), it is a constant • In terms of Z (reflectivity), it is a function of range (1 /r2) • A limitation for long range detection of weak echoes is the radar sensitivity! • If the reflectivity of the target is below MDS then the radar does not detect it! • Beware of artificial MDS!The display of the radar data may be thresholded! Some data may not be displayed!
Homework Question 1 • If the MDS is -10 dBZ at 10 km • What is the MDS at 100 km?
Rain Rate Note that if N is number concentration and D is particle size and uniform Z = N D6
Terminal Velocity of Hydrometeors Gunn-Kinzer 1949 Velocity [cm/s] Radius [microns] Beard and Pruppacher, 1969
So, can your radar see drizzle of a reflectivity of say -5 dBZ?
-5dBZ So, how far can you see drizzle (-5dBZ)?Or anything else? P = C Z r2 Minimum Detectable Signal (power) ~ 25km
7dBZ Typical Drizzle reflectivity Data in this shaded area is thresholded (not displayed)! ~ 25km Can you see drizzle – part 2?The Artificial MDS Situation
Typical Radars Reflectivity vs Range for Constant Power (1/r2) Where does your radar fit on this diagram? Go ask your radar engineers.
Beamheight Considerations Do you know what your minimum elevation angle is?
Note: the lower the beam the longer the range for detection ability! Beam totally overshoots the weather beyond this range! No detection at all! Shallow Weather The weather is detected but the beam is not filled beyond this range, so reflectivities are quantitatively underestimated from this range and beyond Minimum Elevation Angle and Beamwidth Impact 1o beamwidth 0.5o
1 km Drizzle is round! Note: Colour scales are different! Drizzle dBZ dBZ ZDR Drizzle is due to warm rain process. Slow growth which results in small drops (0.1 mm, 1 mm/h) Saltikoff, FMI
Summary: Drizzle in Finland! • Why was drizzle observed in Finland but not Germany? Thresholded! • Why is the drizzle observed only around the radar? Sensitivity • Why is the reflectivity pattern stronger near the radar and decreases away from the radar? Beamfilling • Why is there a range limit to see drizzle? ~80-100km, function of sensitivity, beamfilling, depth of the drizzle! Saltikoff, FMI
Germany Example 3 5-6°C Drizzle ,, Unusual widespread drizzle from cloud echoes aloft. At surface only few echoes above 1dBZ. Note: change in threshold for DWD, see more drizzle! Hamburg Lang, DWD
Major Factors for Detection • Radar Sensitivity • Target Reflectivity/Radar MDS combination • Overshoot • Lowest Angle of Radar/Height of weather / Earth Curvature combination • Beam filling (quantitative) • Weather is too shallow or too low • Beam is very broad • Thresholding • Artificial MDS = Minimum Displayed Signal* * Saltikoff Use laser to select the most significant for your radar system/display!
FOG Can the radar see fog?
FogSpecial Cloud/Fog Radar (35 GHz or Ka Band) Non-operational dBZ 10 km Drop Size Distributions Fog has drop sizes from 10 to 30 microns, so very low reflectivities. An operational radar has a sensitivity as -8 dBZ at 50 km. What is the controlling factor of detecting fog for this radar?
Partial Beam Filling Range bins that are partially beamfilled, decreasing reflectivity with range! 0.5 degree
Vertical Profile of Snow Function of Range 2. The same vertical profile as observed by radar at increasing range due to beam filling, beam broadening (smoothing) and Earth curvature (can’t see lowest levels)! 1. Snow originates aloft but grows as it falls.
Effective Range of a Radar for QPE before Vertical Profile Adjustments Quantitative Impact of Beamfilling Note the fall off of values with range. This is NOT attenuation to which this is commonly attributed. It is a beam filling effect! Michelson, SMHI
Impact of Beamwidth / Beamfilling30 day Accumulation 1.0o (blue) 0.65o (no blue) Example of the impact of beamwidth or beamfilling on quantitative precipitation estimation. One radar is 0.65o and the rest are 1.1o beamwidth radars. Smaller beamwidth means less beamfilling problems with range and farther quantitative reflectivity information. Patrick, EC
Applying the Correctionaka Vertical Profile Correctionaka Range Correction Koistinen, FMI
Atmosphere is very layeredYou want to see low levels! Vertical profile of reflectivity 1 2 3 4 5 5 layers? Virga 3 flow regimes evident but really 5?
Radars in the MountainsOften on top for surveillance reasons Ke = 5/4 Can’t see low levels Germann, MCH
Precipitation is on the flow when the flow is blocked. Radial velocity Reflectivity