Download
1 / 23
230 likes | 317 Vues
Explore how H3's hyperbolic space layout technique aids in organizing large graphs, providing focus+context views, accommodating hierarchal structures, and overcoming common layout stumbling blocks. Learn about sphere packing challenges, strengths, weaknesses, and related works in graph-drawing research.

E N D
H3: Laying Out Large Directed Graphs in 3D Hyperbolic Space Andrew Chan CPSC 533C March 24, 2003
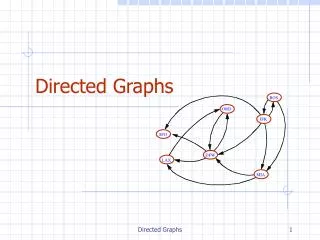
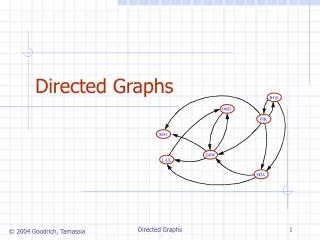
H3 Image from: http://graphics.stanford.edu/papers/h3/fig/nab0.gif
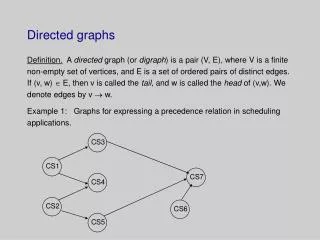
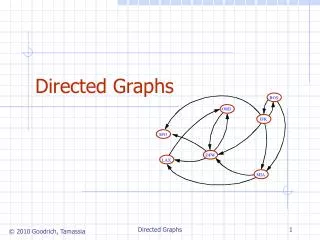
Ideas behind H3 • Creating an optimal layout for a general graph is tough • Creating an optimal layout for a tree is easier • Often it is possible to use domain-specific knowledge to create a hierarchical structure from a graph
Stumbling Blocks • The deeper the tree, the more nodes; exponential growth • You can see an overview, or you can see fine details, but not both
Solution • A layout based on hyperbolic space, that allows for a focus + context view • H3 used to lay out hierarchies of over 20 000 nodes
Related Work • H3 has its roots in graph-drawing and focus+context work
2D Graph and Tree Drawing • Thinking very small-scale • Frick, Ludwig, Mehldau created categories for graphs; # of nodes ranged from 16 in the smallest category, to > 128 in the largest
2D Tree Drawing (cont’d) MosiacG System Zyers and Stasko Image from: http://www.w3j.com/1/ayers.270/paper/270.html
3D Graph Drawing SGI fsn file-system viewer Image from: http://www.sgi.com/fun/images/fsn.map2.jpg
3D Graph Drawing (cont’d) • Other work centered around the idea of a mass-spring system • Node repel one another, but links attract • Difficulty in converging when you try to scale the systems • Aside: Eric Brochu is doing similar work in 2D - http://www.cs.ubc.ca/~ebrochu/mmmvis.htm
3D Tree Drawing Cone Trees, Robertson, Mackinlay, Card Image from: http://www2.parc.com/istl/projects/uir/pubs/items/UIR-1991-06-Robertson-CHI91-Cone.pdf
Hyperbolic Focus+Context Hyperbolic Tree Browser, Lamping, Rao Image from: http://www.acm.org/sigchi/chi95/Electronic/documnts/papers/jl_figs/strip1.htm
Alternate Geometry • Information at: http://cs.unm.edu/~joel/NonEuclid/ • Euclidean geometry • 3 angles of a triangle add up to? • Shortest distance between two points? • Spherical geometry • How we think about the world • Shortest way from Florida to Philippines?
Alternate Geometry (cont’d) • Hyperbolic Geometry / Space • Is important to the Theory of Relativity • The “fifth” dimension • Can be projected into 2-D as a pseudosphere • Key: As a point moves away from the center towards the boundary circle, its distance approaches infinity
H3’s Layout Image from: http://graphics.stanford.edu/papers/h3/fig/nab0.gif
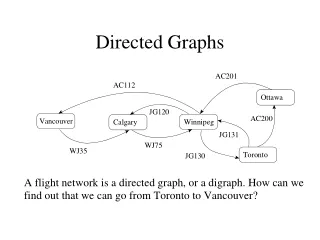
Finding a Tree from a Graph • Most effective if you have domain-specific knowledge • Examples: • File system • Web site structure • Function call graphs
Tree Layout Cone tree layout versus H3 Layout Image from: http://graphics.stanford.edu/papers/h3/html/node12.htm#conefig
Sphere Packing • Need an effective way to place information • Cannot place spheres randomly • Want to have a fast algorithm
Sphere Packing (cont’d) Image from: http://graphics.stanford.edu/papers/h3/fig/incrhemi.gif
Strengths • Can easily see what the important structures are and the relationships between them • Can let you ignore “noise” in data • Animated transitions • Responsive UI
Weaknesses • Starting view only uses part of the sphere • Moving across the tree can disorient you; cost of clicking on the wrong place is high • Labels not present if node too far from center