Download

1 / 29
290 likes | 429 Vues
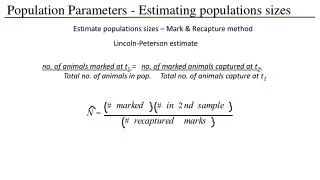
Estimating Urban Populations in the Bronze and Iron Ages. Dan Pasciuti Department of Sociology Johns Hopkins University. Historical Urbanization Single Indicator Methods. Tertius Chandler and Gerald Fox (1974) 3000 Years of Urban Growth Tertius Chandler (1987) 4000 Years of Urban Growth

E N D
Estimating Urban Populationsin the Bronze and Iron Ages Dan Pasciuti Department of Sociology Johns Hopkins University
Historical UrbanizationSingle Indicator Methods • Tertius Chandler and Gerald Fox (1974) • 3000 Years of Urban Growth • Tertius Chandler (1987) • 4000 Years of Urban Growth • Paul Bairoch (1988) • Cities and Economic Development • La population des villes européennes, 800-1850 : banque de données et analyse sommaire des résultats • Jan DeVries (1984) • European Urbanization 1500-1800 • Roland Fletcher (1995) • The Limits of Settlement Growth • George Modelski (2003) • World Cities, -3000 to 2000
Tertius Chandler • Revised and updated 1987 • Based upon resources at UC Berkeley • The “Multiplier” Method • Total Size Estimates • Census Data • Area Estimates • Institutional Factors • Families, Houses, Militia, Religious Institutions • Volume of Local Activity • Disasters • Comparisons • Kaifeng (1642) and Hangchow (1862) to 1930 proportions
Paul Bairoch • Began from Chandler and Fox (1974) • Expanded database • European cities by 15% and Latin America by 50% • Indicators • Urban Area • Residential Space • Density of Occupation
Jan DeVries • Examines 379 cities of populations greater than 10,000 • National Census data from 1800 (364) • Additional Cities (15) • Indicators • Baptisms and Burials • Church attendance • Archives • “General knowledge of the city”
Bairoch vs. De Vries • Separate Databases of Urban Populations • Comparison of total population of 91 cities with populations over 20,000 (from De Long and Shleifer 1992) • 0.6 Percent variation between total urban estimations of Europe 1700-1800
Roland Fletcher • Limits of Settlement Growth • Low Density vs. High Density Settlements • City Database • Detailed analysis of 21 cities (Library of Congress) • All estimates considered valid • Total urban history
Comparisons CONSTANTINOPLE (ISTANBUL) Populations in thousands
Comparisons BAGHDAD Populations in thousands
ESTIMATORS Average Number of People per Dwelling Average Number of Families per Dwelling Average Number of People per Family Size of Dwellings Average Total Urban Population Density Average Urban Residential Population Density INDICATORS Walled Urban Area Total Urban Area Residential Area Number of Residential Hearths Number of Houses Nonresidential Area Number of Families Multiple Indicator Method
Average Number of People per Dwelling • 5.5 Taken from Alston (2002) The City in Roman and Byzantine Egypt • Matches census data from London (average from 1801 and 1639) • Average Floor Area per Residential House • 214m2 from Alston (2002) • Average Number of Families per Dwelling • 1.4 from Alston (2002) • Supported by London Census data (average of 1.5 from 1639 - 1801) House Sizes by Alston (2002)
London • Average Number of People per Family • Average Population Density of Urban Area • Average Population Density of Residential Urban Area • Residential Area vs. Total Area
Average Number of Families per Dwelling • 1.4 from Alston (2002) • Supported by London Census data (average of 1.5 from 1639 - 1801) Average Population Density of Urban Area * Population estimates in thousands ** London area in hectares
Average Population Density of Residential Urban Area • London Census Data (1639 and 1801) • 490 and 498 per hectare respectively • Residential Area vs Total Urban Area • London Census Data and Estimations • 250 Persons per hectare Total Area and 500 Persons per hectare Residential Area • Historical estimations (Bagnall 1993)
TOTAL URBAN POPULATION Estimate Estimate Estimate Estimate 5.5 per House 3.8 per Household 500 per Hectare Total Families Total Residential Area 250 per Hectare 1.4 Households per House Percent Residential Dwelling 214 m2 Total Houses Total Houses Total Urban Area 2.0 Hearths per House Estimates Total Hearths Indicators
LONDON 1600 293,656 306,467 285,650 291,500 5.5 per House 4.1 per Household 500 per Hectare 74,748 Families 571.3 Hectares 250 per Hectare 1.4 Households per House 49% Residential Dwelling 214 m2 53,392 Houses 53,392 Houses 45.8 Houses per Ha 1166 Hectares 2.0 Hearths per House Chandler 187,000 Bairoch 200,000 Galley 200,000 Brett-James 250,000 Total Hearths Brett-James 1166 ha Total Area (est from map)
LONDON 1650 459,173 444,145 446,650 428,250 5.5 per House 3.8 per Household 500 per Hectare 116,880 Families 839.3 Hectares 250 per Hectare 1.4 Households per House 49% Residential Dwelling 214 m2 83,486 Houses 83,486 Houses 48.7 Houses per Ha 1713 Hectares 2.0 Hearths per House Total Hearths Chandler 410,000 Brett-James 350,000 Brett-James est 84,000 homes (1681) 1713 ha Total Area (est from map)
LONDON 1700 587,880 568,644 571,500 583,250 5.5 per House 3.8 per Household 500 per Hectare 149,643 Families 1143 Hectares 250 per Hectare 1.4 Households per House 49% Residential Dwelling 214 m2 106,888 Houses 106,888 Houses 45.8 Houses per Ha 2333 Hectares 2.0 Hearths per House Chandler 550,000 Bairoch 575,000 Galley 575,000 Brett-James 527,000 Total Hearths Brett-James 106,888 homes (1708) 2333 ha Total Area (est from map)
LONDON 1800 974,732 942,832 948,150 967,500 5.5 per House 3.8 per Household 500 per Hectare 248,114 Families 1896.3Hectares 250 per Hectare 1.4 Households per House 49% Residential Dwelling 214 m2 177,224 Houses 177,224 Houses 45.8 Houses per Ha 3870 Hectares 2.0 Hearths per House Chandler 861,000 Bairoch 948,000 Galley 960,000 Total Hearths Brett-James 3870 ha Total Area (est from map)
PALERMO 1276 48,400 50,512 49,000 50,000 5.5 per House 4.1 per Household 500 per Hectare 12,320 Families 98 Hectares 250 per Hectare 1.4 Households per House 49% Residential Dwelling 214 m2 8,800 Houses 8,800 Houses 200 Hectares 2.0 Hearths per House Total Hearths Russell 50,000 Russell 200 hectares(1266-1285) Beloch 8,800 homes(1276)
PALERMO 1347 22,451 23,431 21,850 22,284 5.5 per House 4.1 per Household 500 per Hectare 5,715 Families 43.7 Hectares 250 per Hectare 1.4 Households per House 49% Residential Dwelling 214 m2 4,082 Houses 4,082 Houses 89.1 Hectares 2.0 Hearths per House Total Hearths Russell 18,000-20,000 Russell 4,082 houses
PALERMO 1478 26,000 26,000 26,000 26,000 5.5 per House 4.1 per Household 500 per Hectare 6,341 Families 52 Hectares 250 per Hectare 1.4 Households per House 49% Residential Dwelling 214 m2 4,727 Houses 4,530 Houses 104 Hectares 2.0 Hearths per House 9,200 Hearths Russell 26,000 Russell 26,000 counted pop
Hermopolis 275 CE 38,500 40,180 37,500 38,250 5.5 per House 4.1 per Household 500 per Hectare 9800 Families 75 Hectares 250 per Hectare 1.4 Households per House 49% Residential Dwelling 107 m2 7,000 Houses 7,000 Houses 153 Hectares 2.0 Hearths per House D. Delia 37,000 Bagnall & Frier 51,380 - 53,200 D. Delia 7,000 estimated Homes Bagnall 120 ha Total Area** Total Hearths
Limitations and Problems • Limitations for Bronze Age Estimations • Estimators based upon London • Hermopolis Example • Limitations for Non West Asian Urban Populations • Estimators based upon European settlements • Need for multiple indicators to accurately create estimations • Without multiple indicators becomes a single indicator method
Low Density vs. High Density Cities (Fletcher) ANGKOR WAT ROME