Download
1 / 30
360 likes | 712 Vues
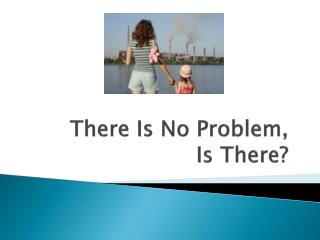
Ecological Footprints: A Model of Unsustainable Use of Resources. Ecological footprint : the amount of biologically productive land and water needed to provide the people in a region with indefinite supply of renewable resources, and to absorb and recycle wastes and pollution

E N D
Ecological Footprints: A Model of Unsustainable Use of Resources • Ecological footprint: the amount of biologically productive land and water needed to provide the people in a region with indefinite supply of renewable resources, and to absorb and recycle wastes and pollution • Per capita ecological footprint: per person • Unsustainable: footprint is larger than biological capacity for replenishment
General Patterns • People in less developed nations use fewer resources • But… many exploit resources to survive • Short-term survival is a more urgent priority than long-term sustainability • People in more affluent/wealthy nations often consume much more than what they need
Humanity’s Ecological Footprint • We are running an ecological deficit – our footprint is larger than earth’s biological capacity to replenish its renewable resources and absorb resulting wastes and pollution • 30% worldwide • 88% in high-income countries
Humanity’s Ecological Footprint • We’re depleting our natural capital instead of living off of the income provided by the capital
Patterns of Natural Resource Consumption Fig. 1-12a, p. 15
Patterns of Natural Resource Consumption Fig. 1-12b, p. 15
Natural Capital Use and Degradation Fig. 1-13, p. 16
Global Human Footprint Map Supplement 8, Fig 7
IPAT is Another Environmental Impact Model I = P x A x T • I = Environmental impact • P = Population • A = Affluence • T = Technology
IPAT Illustrated Fig. 1-14, p. 17
IPAT Generalizations • Less developed nations • Population size and degradation of renewable resources most important • More developed nations • Per capita resource use and overconsumption most important • In the future we’ll have more people AND higher per capita resource use
Case Study - China • World’s largest population – 1.3 billion people • World’s second-largest economy • Leading consumer of wheat, rice, meat, coal, fertilizer, steel, and cement • 2nd-largest consumer of oil • Who’s first? • Largest consumer of goods such as TVs, cell phones, refrigerators… • By 2015, it’s project they’ll be the largest producer and consumer of cars
Case Study - China The bad: • 2/3 of the world’s most polluted cities are in China • Many rivers are polluted and full of waste • Much of the coastline is essentially lifeless • Air pollution from China affects other Asian countries, the Pacific Ocean and the West Coast of North America
Case Study - China The good: • China has produced more wind turbines than any other country • Soon to become the world’s largest producer of solar cells • Most cars produced in China are more fuel efficient than those being produced in the US and Europe
Case Study - China The unknown: • What if their economy continues to grow? • China’s population could reach 1.5 billion by 2025 • It’s possible they’ll need 2/3 of the world’s current grain harvest, twice the world’s current paper consumption, and more than all the oil currently being produced in the world • India’s population is expected to surpass China’s by 2033 • Is it realistic for everyone to live the “American dream?”
Natural Systems Have Tipping Points • Ecological tipping point: an often irreversible shift in the behavior of a natural system • Environmental degradation has time delays between our actions now and the deleterious effects later • Long-term climate change • Over-fishing • Species extinction
Tipping Point Fig. 1-15, p. 19
Cultural Changes Have Increased Our Ecological Footprints • 12,000 years ago: hunters and gatherers • Three major cultural events • Agricultural revolution (10000- 12000 years ago) • Industrial-medical revolution (275 years ago) • Information-globalization revolution (50 years ago) • Current need for a sustainability revolution
Technology Increases Population Fig. 1-16, p. 19
1-3 Why Do We Have Environmental Problems? • Concept 1-3 Major causes of environmental problems are population growth, wasteful and unsustainable resource use, poverty, and exclusion of environmental costs of resource use from the market prices of goods and services.
Experts Have Identified Four Basic Causes of Environmental Problems • Population growth • Wasteful and unsustainable resource use • Poverty • Failure to include the harmful environmental costs of goods and services in market prices
Exponential Growth of Human Population Fig. 1-18, p. 21
Affluence Has Harmful and Beneficial Environmental Effects • Harmful environmental impact due to • High levels of consumption • High levels of pollution • Unnecessary waste of resources • Affluence can provide funding for developing technologies to reduce • Pollution • Environmental degradation • Resource waste
Poverty Has Harmful Environmental and Health Effects • Population growth affected • Malnutrition • Premature death • Limited access to adequate sanitation facilities and clean water
Extreme Poverty Fig. 1-19, p. 22
Harmful Effects of Poverty Fig. 1-20, p. 22
Effects of Malnutrition Fig. 1-21, p. 23
Prices Do Not Include the Value of Natural Capital • Companies do not pay the environmental cost of resource use • Goods and services do not include the harmful environmental costs • Companies receive tax breaks and subsidies • Economy may be stimulated but there may be a degradation of natural capital
Environmentally Unfriendly Hummer Fig. 1-22, p. 24