Download
1 / 34
340 likes | 461 Vues
ASSESSING HEALTH REQUIREMENTS AND SETTING DIETARY STANDARDS FOR MINERALS. NUTRITIONAL CONCERNS. Evaluating Individual Need. Evaluating Individual Status. Setting Standards for optima. Population Approach. Experimental. Biomarkers. Balance Studies. Functional tests.

E N D
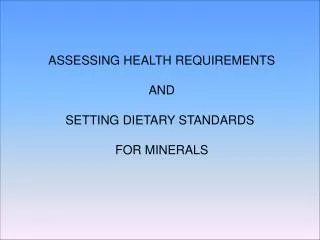
ASSESSING HEALTH REQUIREMENTS AND SETTING DIETARY STANDARDS FOR MINERALS
NUTRITIONAL CONCERNS Evaluating Individual Need Evaluating Individual Status Setting Standards for optima Population Approach Experimental Biomarkers Balance Studies Functional tests
Assessing Mineral Status Major Categories to Consider and Attack Body stores of the mineral Functional indices Response to increase intake Caution: Seldom can one mineral be evaluated by all three. Choice of most favorable will depend on the mineral being assessed.
EAR: Estimated Average Requirement UL: upper limit RNI: Recommended nutrient intake LOAEL: Lowest observed adverse effect level NOAEL: No observed adverse effect level Acceptable range of intake LOAEL NOAEL EAR (50%) RNI (97.5%) UL (0%) Cumulative Risk 1.0 0.5 Risk of deficit Risk of excess Intake How are data that generates this curve obtained?
Question: How does one assess mineral status? Question: How do we estimate safe mineral intake? Approaches 1. Balance studies 2. Clinical observations 3. Optimal intake 4. Evidence-based approaches 5. Sub-clinical evaluations
BalanceApproach(keeping the status quo) Matching input with excretion Assess the ability of the system to: Maintain body stores Recover loss due to metabolic turnover Delay appearance of clinical signs Problems: Choice of endpoint dubious Choice of time may be critical Overlooks prior exposure and system adaptation
Kout Kin A B D K1 K-1 Retention C Kin Kout = Balance Kin Kout > Positive Balance (growth) Absorption-Excretion Negative Balance (wasting) Kin Kout < K1 = K-1 Balance K1 K-1 Retention > Positive Balance K1 < K-1 Negative Balance Balance Matching what goes in with what goes out Absorption Excretion
Problems With Balance as a Criterion of Amount 1. End Point is in doubt 2. Excretion is episodic not continuous 3. Multiple connecting pools of the same mineral 4. System adaptation
Clinical Approach: Look for or create a disease state Look for a structural or functional abnormality Link these with known biochemical or functional changes Parameters: Growth rate Physical appearance (skin, bone, hair, etc.) Physiological impairments (gastrointestinal, immune and nervous system) Cognitive functions Biochemical impairments (stress factors, enzymes and metabolic factors) Medical (proneness towards disease)
Optimal Intake Approach for Assessing Requirement Specific nutrient requirement of minerals is that which: 1. Optimize physical or mental performance 2. Thwarts or reverses disease 3. Increase longevity Compare with an accepted standard Example: 1. Optimal mineral nutrition of milk should duplicate the composition of human milk. Problems: 1. Too general 2. Defies population-based approaches
Evidence Based Approach Evaluate studies pro and con and weigh strengths, weaknesses, design differences, etc. in arriving at a set of numbers More a propos to setting dietary risk standards than determining requirements:
Sub-clinical (Functional) Approach Biomarkers of adequacy and deficiency
An ideal biomarker is some reliable internal factor that responds directly, specifically, and quantitatively to changes in a mineral’s homeostasis
Its function is to signal a disturbance in the functional stores of a mineral
The most common signal elicited is a depression in blood or tissue levels of the mineral
Body stores of the mineral Applies mainly to iron Circulating levels of ferritin are a measure of iron tissue stores Total iron binding capacity (TIBC) Transferrin saturation Hematocrit Hemoglobin levels Red cell morphology
Functional indices Inadequate intake of some minerals causes major perturbations in biochemistry. This is most noted by depressed levels of enzymes, homones, or altered tissue morphology. Its imperative that a direct connection exist between the mineral in question and the functional component. Examples Suspect Measure Iodine deficiency circulating thyroid hormone Copper deficiency plasma ceruloplasmin Selenium deficiency glutathione peroxidase
Organs and Systems that Play a Major Role in Mineral Homeostasis Gastrointestinal tract Mineral Absorption Endogneous excretion Kidneys Iron Single major site --- --- Copper Substantial Major (liver) --- Manganese Major Major (liver) --- Zinc Major Major --- Iodide Major Selenium (After Hambidge, 2003) Major Chromium Major Molybdenum Major
Assessment of Iron
4-5 grams of iron Erythrocytes 2.5 grams Two- thirds 10 -14 mg ingested Absorption 0.5 -2 mg Excretion 1-2 mg Plasma - 4 mg (0.08-0.1%) Ferritin Storage 1,500 mg Myoglobin 200 mg Enzymes 5 mg Liver, spleen, bone marrow one-third Myoglobin, mitochondria -one third
Measurement of Iron status • Transferrin saturation • TIBC (total iron binding capacity) • UIBC (unsaturated iron binding capacity) • 33% saturated normally • 47% in the morning (after fasting) • 13% at night • TIBC = 400 ug/dl …..deficient • = 200 ug/dl…..inflammation Test is performed when there is concern for anemia, iron deficiency, or iron deficiency anemia
Meaning of Terms TIBC = Iron binding capacity of a volume of serum (dL) Expressed as ug of iron needed to fill all Tf molecules in that volume Determined spectrophotometrically UIBC = total iron in a volume of serum / TIBC for that volume Expressed as percentage of saturated transferrin Determined by atomic absorption analysis of iron in serum UIBC first determines how much iron is present in a serum sample. 99% of that iron is bound to transferrin. TIBC says how much iron is needed to fill all vacancies on the transferrin in that volume of serum. Comparing how much is there to how much is need to fill vacancies measures percent saturation
Saturation Fe Measuring TIBC Draw Blood Serum Fe3+ Change in color due to more Tf becoming saturated with iron Centrifuge Blood Cells Fe-Tf complex The amount of Fe3+ required to reach saturation of all the transferrin present is a measure of the total iron binding capacity (TIBC)
61% 39% Sample Problem (Note: Knowing the exact amount of Tf is unnecessary) An clinical lab draws 5 ml of blood to determine the TIBC and UIBC of a patient. 2 ml of the serum from the blood requires 12 ug of iron to reach saturation. That same serum contains 4.7 ug of iron per ml. Calculate the patients TIBC? UIBC? What can you conclude about the patients iron status? Solution TIBC is expressed in deciliters (dL) of blood. One deciliter = 100 mL If 2 ml requires 12 ugm of iron, 100 mL requires 50 x 12 = 600 ugm TIBC = 600 ugm/dL UIBC is expressed as percent of saturation If 4.7 ugm is present in 2 mL, 100 mL contains 50 x 4.7 = 235 ugm UIBC = 235/600 x 100 = 39% saturated Within NORMAL range
Ferritin (major iron storage protein) 1. Most sensitive indicator of iron stores Adults 1 g ferritin/L plasma = 8 mg stored iron (Bothwell et al, 1979) <12 ng ferritin/L plasma = no iron stores Children 1 g ferritin/L plasma = 14 mg stored National Surveys Percentile Men (19-30) Women (19-30) Children ( g ferritin/L plasma) 5th 36 7 6 50th 112 36 23 99th 394 212 116
Problems with Ferritin An Acute phase protein that is elevated in: inflammations infections disease (neoplasms especially of the colon, cardiovascular) ethanol consumption hyperglycemia body mass index
New Frontiers with Iron Soluble transferrin receptor concentration of the plasma (a good index of early iron deficiency) Basis of analysis Cells requiring iron express transferrin receptors Extracellular domain or the receptors is subject to proteolytic cleavage and released into plasma Number of receptors is in proportion to the number that were expressed on the cell surface…which measures iron requirement
Clinical Evaluation of Zinc Adequacy Before and After Zn Therapy
Problem: Assume you are a physician who specializes in mineral deficiencies. A patient is referred to you by his physician who suspects a zinc deficiency. How can you confirm the diagnosis? Give the pros and cons for each of the following 1. Measure serum zinc levels The above scenario also applies to a veterinarian who is attempting to determine the reason for stunted growth in livestock and suspects zinc deficiency as the cause 2. Measure 24 hr urine zinc excretion 3. Measure fecal zinc excretion 4. Measure lymphocyte zinc content 5. Measure zinc in hair 6. Measure liver zinc 7. Measure activity of a zinc-dependent enzyme 8. Measure metallothionein levels of blood or mRNA in monocytes 9. Measure body pools of zinc with radioactive tracer
Zinc (a major trouble mineral for biomarkers) Problems with Zinc: 1. Zn deficiency can be manifested by slight decrements in tissue Zn. An impairment can occur before a change is detected. 2. Internal Zn changes are immediately corrected by a very effective homeostatic mechanism. Thus a biomarker may never be turned on 3. Zinc’s usage is so wide-spread and interconnected that to focus on any one factor is not always practical. 4. Plasma contains only about 0.1% of the body Zn, questioning whether plasma Zn changes reflect total body Zn. Nonetheless, plasma Zn is currently the most widely used and accepted biomarker of Zn status. 5. Plasma Zn is depressed whenever an acute phase response is triggered 6. Plasma Zn tends to be down in hypoalbuminemia
IS PLASMA ZINC THE BEST INDICATOR OF ZINC STATUS Experimental Observations: 1. No correlation was found between intake/absorption and plasma Zn levels over a wide range of dietary Zn in adult women (Sian et al, 1996). But, dietary and absorbed Zn was found to correlate with dynamic Zn pool size (Sian et al, 1996; Krebs et al, 2000). Comment: Evidence for a rapid self-correcting homeostatic mechanism? 2. Young children with a Zn-limiting growth impairment have plasma Zn levels within the normal range (Wada et al, 1985) 3. Low plasma Zn levels (<70 ug/L) are a good predictor of growth response to oral Zn supplementation.
OTHER ZINC INDICATORS • Cellular components (carbonic anhydrase). The major erythrocyte pool of zinc. But, • 1. Does not turnover • 2. Membrane-bound Zn also a factor • 3. applies also to monocyte, neutrophil, and platelet Zn • Hair Zn. Good marker. But, • 1. More relevant to chronic as opposed to transient Zn status • Zinc Excretion (urine and feces) • 1. Requires tracers and metabolic collection • 2. More applicable to research than clinic screening • Tissue stores • 1. Also requires tracer and sample collection over many days • 2. Metallothionein mRNA (PCR) in monocytes promising
OTHER ZINC (cont.) • Zinc-dependent enzymes. Suppression of the following is inconsistent • 1. Alkaline phosphatase • 2. CuZn superoxide dismutase • 3. lymphocyte 5’-nucleotidase • Response to Zn supplementation • 1. Dietary levels was also be taken into account • 2. Response to Zn must be specific and non-pharmacological