Circular dichroism spectroscopy
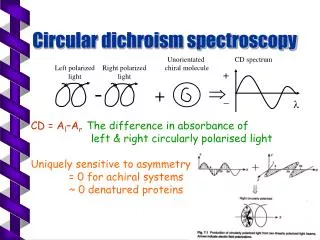
Circular dichroism spectroscopy. Unorientated chiral molecule. CD spectrum. CD = A l –A r The difference in absorbance of left & right circularly polarised light Uniquely sensitive to asymmetry = 0 for achiral systems ~ 0 denatured proteins.

Circular dichroism spectroscopy
E N D
Presentation Transcript
Circular dichroism spectroscopy Unorientated chiral molecule CD spectrum CD = Al–Ar The difference in absorbance of left & right circularly polarised light Uniquely sensitive to asymmetry = 0 for achiral systems ~ 0 denatured proteins Left polarized light Right polarized light + - + _
CD Spectra Varying absorption of circularly polarised light by chiral molecules results in distinctive spectra under absorption bands Need chiral light and chiral molecule to get CD spectrum of a solution
CD spectropolarimeter Max light intensity: 300-400 nm M = mirror P=prism Quartz 1/4l- plate. Oscillates at ~ 50 Hz CPL Monochromater prism CD=A/(absorbance units)=4(degrees)/(180ln10) CD=(millidegrees)/32,980
Empirical analysis of CD HPLC detector Structural change
CD requires helical electron motion Require magnetic dipole transition moment 0 Require electric dipole transition moment 0
CD from coupled oscillators R = CD strength = Im(.m) =electric dipole transition moment m=magnetic dipole transition moment -* transition of a helical polypeptide High energy, 190 nm Low energy, 208 nm
Carbonyl CD -axial adamantanones z y y z -equatorial adamantanones
Tris chelate in ligand transitions -enantiomer -[Ru(4,7-dimethylphenanthroline)3]2+ Equal & opposite Assign transitions
Protein CD a-helical protein spectra are distinctive :222,208,190 nm other motifs also have well- defined spectra CD spectra depend on AVERAGE solution phase protein structure Use to determine how environment — temperature, pH, solvent, ionic strength, denaturing agents — alters protein structure. Also binding constants. Quick easy experiment that doesn’t consume sample
CD to answer: does it change structure? Reduced and unreduced plant defensins ??? Can we use mass spectrometry to give structural Information: want to use 50% MeCN. In fact OK.
Protein structure analysis from CD spectra Distinctive spectra can be described for pure backbone conformations in the absence of side chains. In principle, the CD of a native protein is the sum of the appropriate percentages of each component spectrum. Must know molar residue (amino acid) concentration. CD spectra can be analysed by the structure-fitting program “cdsstr” (of C.J. Johnson) to obtain % of secondary structure motifs. Cdsstr uses a basis set of protein spectra Lysozyme CD in molar residue 32% helix for lysozyme in water
Hydrophobic region Transmembrane -helix SPP TPP N C Protein conformation as a function of environment Tris buffer soluble Pre-PSbW and and Unfolded using Guanidinium Chloride Pre-PsbW, thylakoid membrane protein ‘No structure’ in guanidinium chloride Some in tris buffer (multimer) Lots in SDS micelles (folded, 2 helices)
- - - CDsstr results for pre-PsbW
Vancomycin & ristocetin Glycopeptide antibiotics that prevent cross-linking and transglycosylation during bacterial cell wall formation. Noncovalent dimerisation plays a key role in their activity CD used to give binding constants V-V, V-R and V-peptides, R-peptides. Assume non-covalent dimers. CD change (induced CD) [dimer] Kdimerisation= 205 (mM)-1 V + R V-R
Nucleic acid CD DNA and RNA polymers:sugar units of the backbone provide the chirality, but not the chromophores. CD spectrum of a polynucleotide arises from interaction between the * transitions of stacked bases. Magnitude is larger at 270 nm and much larger at 200 nm relative to isolated nucleosides. CD to identify which polymorph: CD varies more with base orientation than sequence
Nucleic acid CD spectra Calf thymus DNA: B-DNA (10.4 bases) A-DNA B-DNA (10.2 bases) B-DNA: 72%, 50% & 31% GC content Poly[d(G-C)] 2: B-DNA A-DNA Z-DNA B-DNA: 275>0, 258=0, 240<0, 220>/=0, 180/190>>>0 A:DNA: 295</=0, 260>>0, 250230>/=0, 210<<0, 190>>0 Z-DNA: 290<0, 260>0, 195/200<<<0, 185 180=0
RNA: CNG repeats (neurological disorders e.g. Myotonic Dystrophy ) Which is melted? Unusual RNAs: adopt duplex A-form plus something else. ??? Triplex.
Induced CD DNA is chiral. Achiral ligands upon binding to DNA acquire an induced CD (ICD) signal into their own electronic transitions due either to (I) The DNA structurally perturbing them and making them chiral, or (II) Their transitions coupling to those of the DNA and acquiring a helical element. 50 M 9-hydroxyellipticine (planar aromatic molecule) + DNA gives induced CD at ligand wavelengths
Induced CD for binding constant determination Anthracene-9-carbonyl-N1-spermine (ISB) ICD=[L bound] = (bound ligand)[L bound] Induced spectroscopy method Can’t determine bound
Sample requirements for CD • Backbone region: 250 nm 180 nm • ~ 150 L of 0.1 mg/mL (~1 mM amino acid, for 20 kDa protein, 5 M) + 1 mm pathlength • Modified optics: focuses light beam to 2 mm x 1 mm, same quality data with ~ 2 L sample in 2 mm wide masked cuvette or ~1 mm diameter capillary • ~200 ng / sample NON-DESTRUCTIVE!
Focal lenses Capilliaries • Jenway: ~1 mm quartz capilliaries for UV absorbance. CD spectra are OK using them either with focusing or masking. Magnitude was 10% larger than 1 mm rectangular cell — 1.1 mm diameter capilliary. • Same spectrum at 0,45,90! ~ 41 p each! • Use focused beam or masked beam. • Seal capilliary or not. Fiddle to fill and get sample in right place for minimum volume. A capillary Sample ~ 3–6 L required Capillary sealed with wax
Cytochrome-c with lens Lens Capillary