Download
1 / 12
120 likes | 288 Vues
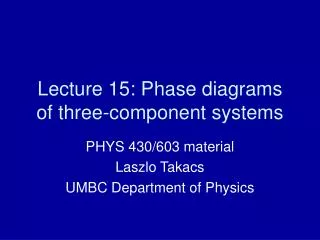
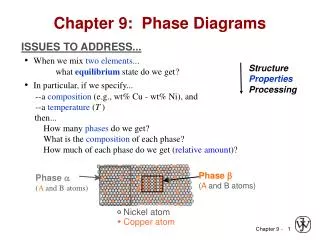
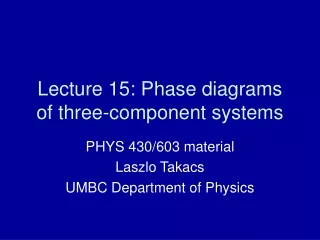
Lecture 15: Phase diagrams of three-component systems. PHYS 430/603 material Laszlo Takacs UMBC Department of Physics.

E N D
Lecture 15: Phase diagrams of three-component systems PHYS 430/603 material Laszlo Takacs UMBC Department of Physics
How to read concentrations from a triangular phase diagram?cA = 100% at point A, 0% along the BC side, and has a constant value along any line parallel to BC. If we draw a parallel to BC through the point of interest (y) we can read the concentration of A on either AB or AC.
It is also customary to use rectangular coordinate axes for two components, especially if those compositions are low. The diagrams can be extended to 3-d to show temperature.
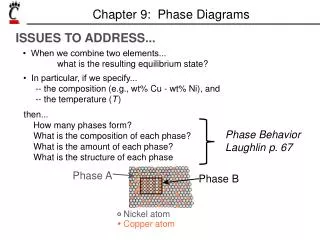
Application of the Gibbs phase rule f = n - P + 2, where • f = number of degrees of freedom (or freely selectable parameters): • Temperature, pressure, composition of the constituent phases • The average composition of a sample is NOT a degree of freedom. • n = number of chemical components • Element or compound • P = number of phases
Single - component f = n - P + 2 • n = 1 • Possible degrees of freedom: T, p • Inside an area, P = 1 f = 2. T and p can be chosen freely. • On a line, 2 phases are in equilibrium, P = 2 f = 1. Either T or p can be chosen, but it fixes the other variable. The relative amounts are not determined by the phase diagram. • On an intersection of lines, 3 phases are in equilibrium, P = 2 f = 0. This is an “invariant” point where the parameters are fixed. How much of each phase is present is undetermined. • Four phases cannot be in equilibrium.
Two - component f = n - P + 2 f’ = n - P + 1, if p is fixed. • n = 2 Possible degrees of freedom: T, p, c of constituent phases • In a single-phase area, P = 1 f’ = 2. T and c can be chosen freely. • In a 2-phase area, P = 2 f’ = 1. If either T, c1 or c2 is chosen, the others get fixed. (E.g. choose c1, the composition of the Ag-based solid solution. That determines T and the horizontal line at that T determines the composition of the Cu-based solution.) Relative quantities by lever rule. • On the invariant line at the eutectic temperature, 3 phases are in equilibrium, (Ag), (Cu), L. P = 3 f’ = 0. There is no free parameter here. The invariant line can be pictured as a flattened triangle containing a mix of all three phases. With that in mind, any area is bordered by areas with one more or one fewer phases.
Three - component f’ = n - P + 1 • n = 3 • Inside an “empty” area, P = 1 f’ = 3. T and two concentration can be chosen freely (the third obviously follows.) • In a “striped” area, P = 2 f’ = 2. T and µ can be chosen freely. Instead of the chemical potential, µ, the composition of one component is usually chosen, The “stripes” are tie lines that fix the composition of the other phase. • In a shaded triangle, 3 phases are in equilibrium, P = 3 f’ = 1. Thus T can be chosen freely, but then the vertices of the triangle determine the concentration of each phase.
3-d representation and projection of the liquidus surface of a 3-component eutectic