TM 661
TM 661. Multiple Investment Alternatives. Summary. NPW > 0 Good Investment. Summary. NPW > 0 Good Investment EUAW > 0 Good Investment. Summary. NPW > 0 Good Investment EUAW > 0 Good Investment IRR > MARR Good Investment. Summary.


TM 661
E N D
Presentation Transcript
TM 661 Multiple Investment Alternatives
Summary • NPW > 0 Good Investment
Summary • NPW > 0 Good Investment • EUAW > 0 Good Investment
Summary • NPW > 0 Good Investment • EUAW > 0 Good Investment • IRR > MARR Good Investment
Summary • NPW > 0 Good Investment • EUAW > 0 Good Investment • IRR > MARR Good Investment Note: If NPW > 0 EUAW > 0 IRR > MARR
Multiple Investments • NPWA > NPWB Choose A • Must use same planning horizon
Multiple Investments • NPWA > NPWB Choose A • Must use same planning horizon • EUAWA > EUAWB Choose A • Same Planning Horizon implicit in computation
Multiple Investments • NPWA > NPWB Choose A • Must use same planning horizon • EUAWA > EUAWB Choose A • Same Planning Horizon implicit in computation • IRRA > IRRB Choose A • Must use Incremental Rate-of-Return IRRB-A < MARR Choose A
Example Suppose we have two projects, A & B A B Initial cost $50,000 $80,000 Annual maintenance 1,000 3,000 Increased productivity 10,000 15,000 Life 10 10 Salvage 10,000 20,000
10 9 9 . . . 0 1 2 3 10 50 Present Worth A A NPW(10) = -50 + 9(P/A,10,10) + 10(P/F,10,10)
10 9 9 . . . 0 1 2 3 10 50 Present Worth A A NPW(10) = -50 + 9(P/A,10,10) + 10(P/F,10,10) = -50 + 9(6.1446) + 10(.3855)
10 9 9 . . . 0 1 2 3 10 50 Present Worth A A NPW(10) = -50 + 9(P/A,10,10) + 10(P/F,10,10) = -50 + 9(6.1446) + 10(.3855) = $9,156
20 12 12 . . . 0 1 2 3 10 Present Worth B B 80 NPW(10) = -80 + 12(P/A,10,10) + 20(P/F,10,10)
20 12 12 . . . 0 1 2 3 10 Present Worth B B 80 NPW(10) = -80 + 12(P/A,10,10) + 20(P/F,10,10) = -80 + 12(6.1446) + 20(.3855)
20 12 12 . . . 0 1 2 3 10 Present Worth B B 80 NPW(10) = -80 + 12(P/A,10,10) + 20(P/F,10,10) = -80 + 12(6.1446) + 20(.3855) = $1,445
Conclusion NPWA > NPWB Choose A
10 9 9 . . . 0 1 2 3 10 50 Equivalent Worth A EUAW(10) = -50(A/P,10,10) + 9 + 10(A/F,10,10)
10 9 9 . . . 0 1 2 3 10 50 Equivalent Worth A EUAW(10) = -50(A/P,10,10) + 9 + 10(A/F,10,10) = -50 (.1627) + 9 + 10(.0627)
10 9 9 . . . 0 1 2 3 10 50 Equivalent Worth A EUAW(10) = -50(A/P,10,10) + 9 + 10(A/F,10,10) = -50 (.1627) + 9 + 10(.0627) = $1,492
20 12 12 . . . 0 1 2 3 10 Equivalent Worth B EUAW(10) = -80(A/P,10,10) + 12 + 20(A/F,10,10)
20 12 12 . . . 0 1 2 3 10 Equivalent Worth B EUAW(10) = -80(A/P,10,10) + 12 + 20(A/F,10,10) = -80(.1627) + 12 + 20(.0627)
20 12 12 . . . 0 1 2 3 10 Equivalent Worth B EUAW(10) = -80(A/P,10,10) + 12 + 20(A/F,10,10) = -80(.1627) + 12 + 20(.0627) = $238
Conclusion EUAWA > EUAWB Choose A
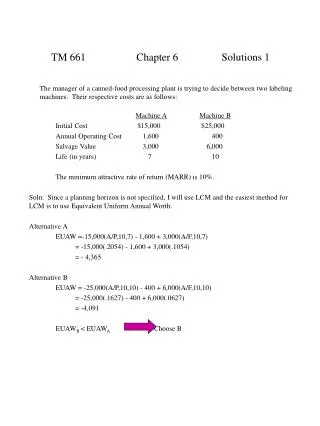
30 115 1 2 3 4 5 100 100 Different Planning Horizons Example: Suppose MARR is 10%. Suppose also that we can invest in T-bill @15% or we can invest in a 5 year automation plan. A B NPW = 30(P/A,10,5) - 100 = $13,724 NPW = 115(1.1)-1 - 100 = $4,545 B
Problem But this ignores reinvestment of T-bills for full 5-year period. 201,135 0 5 100 NPW = 201.135(P/F,10,5) - 100 = $24,889 A
Conclusion Projects must be compared using same Planning Horizon
4,500 3,500 3 4,000 Example; NPW A NPW = -4 + 3.5(P/A, 10,3) + 4.5(P/F,10,3)
4,500 3,500 3 4,000 Example; NPW A NPW = -4 + 3.5(P/A, 10,3) + 4.5(P/F,10,3) = -4 + 3.5(2.4869) + 4.5(.7513) = 8.085 = $8,085
Example: NPW 5,000 3,000 B 3 6 NPW = -5 + 3(P/A,10,6) + 5(P/F,10,6) 5,000
Example: NPW 5,000 3,000 B 3 6 NPW = -5 + 3(P/A,10,6) + 5(P/F,10,6) = -5 + 3(4.3553) + 5(.5645) 5,000
Example: NPW 5,000 3,000 B 3 6 NPW = -5 + 3(P/A,10,6) + 5(P/F,10,6) = -5 + 3(4.3553) + 5(.5645) = 10.888 = $10,888 5,000
Planning Horizons • Least Common Multiple • Shortest Life • Longest Life • Standard Planning Horizon
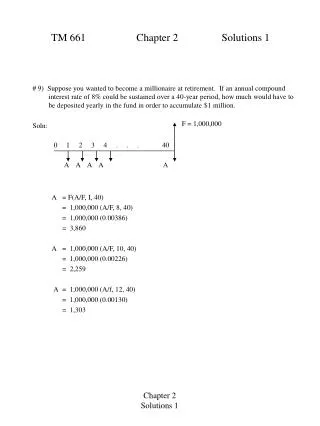
4,500 4,500 3,500 3 6 4,000 4,000 Example; NPW A NPW = -4 -4(P/F,10,3) + 3.5(P/A,10,6) + 4.5(P/F,10,3) + 4.5(P/F,10,6)
4,500 4,500 3,500 3 6 4,000 4,000 Example; NPW A NPW = -4 -4(P/F,10,3) + 3.5(P/A,10,6) + 4.5(P/F,10,3) + 4.5(P/F,10,6) = -4 + .5(P/F,10,3) + 3.5(P/A,10,6) + 4.5(P/F,10,6)
4,500 4,500 3,500 3 6 4,000 4,000 Example; NPW A NPW = -4 -4(P/F,10,3) + 3.5(P/A,10,6) + 4.5(P/F,10,3) + 4.5(P/F,10,6) = -4 + .5(P/F,10,3) + 3.5(P/A,10,6) + 4.5(P/F,10,6) = -4 + .5(.7513) + 3.5(4.3553) + 4.5(.5645)
4,500 4,500 3,500 3 6 4,000 4,000 Example; NPW A NPW = -4 -4(P/F,10,3) + 3.5(P/A,10,6) + 4.5(P/F,10,3) + 4.5(P/F,10,6) = -4 + .5(P/F,10,3) + 3.5(P/A,10,6) + 4.5(P/F,10,6) = -4 + .5(.7513) + 3.5(4.3553) + 4.5(.5645) = 14.159 = $14,159
Example: NPW 5,000 3,000 B 3 6 NPW = -5 + 3(P/A,10,6) + 5(P/F,10,6) 5,000
Example: NPW 5,000 3,000 B 3 6 NPW = -5 + 3(P/A,10,6) + 5(P/F,10,6) = -5 + 3(4.3553) + 5(.5645) 5,000
Example: NPW 5,000 3,000 B 3 6 NPW = -5 + 3(P/A,10,6) + 5(P/F,10,6) = -5 + 3(4.3553) + 5(.5645) = 10.888 = $10,888 5,000
Conclusion NPWA > NPWB Choose A
4,500 3,500 3 4,000 EUAW A EUAW = -4(A/P,10,3) + 3.5 + 4.5(A/F,10,3) = -4(.4021) + 3.5 + 4.5(.3021) = 3.251 = $3,251 Note: NPW = 3,251(P/A,10,6) = 3,251(4.3553) = $14,159
EUAW 5,000 3,000 B 3 6 EUAW = -5(A/P,10,6) + 3 + 5(A/F,10,6) = -5(.2296) + 3 + 5(.1296) = 2.500 = $2,500 Note: NPW = 2,500(P/A,10,6) = $10,888 5,000
EUAW Equivalent Uniform Annual Worth method implicitly assumes that you are comparing alternatives on a least common multiple planning horizon
Class Problem Two alternatives for a recreational facility are being considered. Their cash flow profiles are as follows. Using a MARR of 10%, select the preferred alternative.
5 4 3 2 1 1 2 3 4 5 11 Class Problem EUAWA = -11(A/P,10,5) + 5 - 1(A/G,10,5) = -11(.2638) + 5 - 1(1.8101) = .2881 = $288
4 3 2 1 2 3 5 Class Problem EUAWB = -5(A/P,10,3) + 2 + 1(A/G,10,3) = -5(.4021) + 2 + 1(.9366) = .9261 = $926
Class Problem EUAWB > EUAWA Choose B
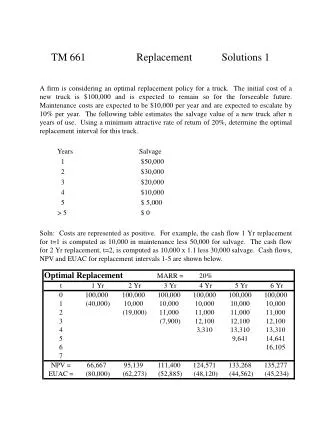
5 4 3 2 1 1 2 3 4 5 11 4 3 2 1 2 3 5 Critical Thinking A Use Net Present Worth and least common multiple of lives to compare alternatives A & B. B
5 4 3 2 1 1 2 3 4 5 11 4 3 2 1 2 3 5 Critical Thinking A Use Net Present Worth and least common multiple of lives to compare alternatives A & B. B NPWA = 288(P/A,10,15) = 288(7.6061) = $2,191
5 4 3 2 1 1 2 3 4 5 11 4 3 2 1 2 3 5 Critical Thinking A Use Net Present Worth and least common multiple of lives to compare alternatives A & B. NPWA = 288(P/A,10,15) = 288(7.6061) = $2,191 NPWB = 926(P/A,10,15) = 926(7.6061) = $7,043 B