Download
1 / 17
170 likes | 457 Vues
REVIEW Confidence Intervals for Means. When to use z and When to use t. USE z Large n or sampling from a normal distribution σ is known. USE t Large n or sampling from a normal distribution σ is unknown. z and t distributions are used in confidence intervals.

E N D
REVIEW Confidence Intervals for Means
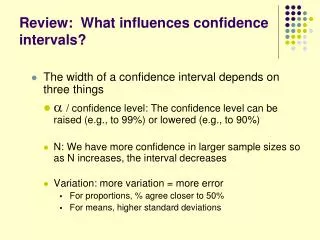
When to use z and When to use t • USEz • Large n or sampling from a normal distribution • σ is known • USEt • Large n or sampling from a normal distribution • σ is unknown z and t distributions are used in confidence intervals. _ These are determined by the distribution of X.
General Form ofConfidence Intervals The general form of a confidence interval is: or (Point Estimate) ± (Margin of Error) (Point Estimate) ± (zα/2 or tα/2) (Appropriate Standard Error)
Example The average cost of all required texts for introductory college English courses seems to have gone up substantially as the professors are assigning several texts. • A sample of 41 courses was taken • The average cost of texts for these 41 courses is $86.15 • Construct a 95% confidence interval for the average costs of texts for these courses assuming: • The standard deviation is $22. • The standard deviation is unknown, but the sample standard deviation of the sample is $24.77.
Case 1 • Because the sample size > 30, it is not necessary to assume that the costs follow a normal distribution to construct a confidence interval. • And because it is assumed that σ is known (to be $22), this will be a z-interval. $86.15 ± $6.73 ($79.42$92.92)
Case 2 • Because the sample size > 30, it is not necessary to assume that the costs follow a normal distribution to construct a confidence interval. • Because it is assumed that σ is unknown, this will be a t-interval with 40 degrees of freedom and s = 24.77. $86.15 ± $7.82 ($78.33$93.97)
EXCELz-Intervals AVERAGE (data set) CONFIDENCE(α,σ,n) The z-interval = (Sample Mean) ± (Margin of Error) Thus, the Lower Confidence Limit (LCL) = AVERAGE(data set) - CONFIDENCE(α,σ,n) And, the Upper Confidence Limit (UCL) = AVERAGE(data set) + CONFIDENCE(α,σ,n)
=AVERAGE(A2:A42) =CONFIDENCE(.05,D1,41)
=AVERAGE(A2:A42) =CONFIDENCE(.05,D1,41) =D3-D5 =D3+D5
EXCELt-Intervals The t-interval = (Sample Mean) ± (Margin of Error) Go to Tools/Data Analysis/Descriptive Statistics From the output, find Mean and Confidence Level Thus, the Lower Confidence Limit (LCL) = MEAN – CONFIDENCE LEVEL and, the Upper Confidence Limit (UCL) = MEAN + CONFIDENCE LEVEL
=D3-D16 =D3+D16
REVIEW • To construct a confidence interval • Must have a large sampleOR assume you are sampling from a normal distribution • Known σ -- z-interval Unknown σ – t-interval • Form of interval: (Sample Mean) ± (Margin of Error) • Calculating margin of error by hand: • Excel: • z-interval – Use CONFIDENCE function • t-interval – Use DESCRIPTIVE STATISTICS in DATA ANALYSIS