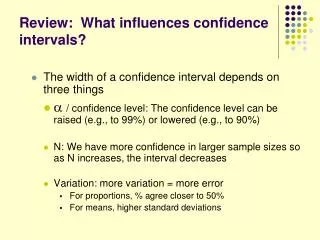
Confidence Intervals Review
Confidence Intervals Review. Probability & Statistics Chapter 6. Find the point estimate of the population mean (to nearest hundredth). 98.11. The following data set represents the repair costs (in dollars) for a random sample of 30 dishwashers.

Confidence Intervals Review
E N D
Presentation Transcript
Confidence Intervals Review Probability & Statistics Chapter 6
Find the point estimate of the population mean (to nearest hundredth) 98.11 The following data set represents the repair costs (in dollars) for a random sample of 30 dishwashers.
Find the margin of error (E) for a 95% level of confidence (to nearest hundredth) 8.85 The following data set represents the repair costs (in dollars) for a random sample of 30 dishwashers.
Which method? In a random sample of seven computers, the mean repair cost was $100.00 and the standard deviation was $42.50. A. Use a t-distribution B. Use a normal distribution
Which method? In a random sample of ten teenagers from the United States, the mean SAT scores was 1035 and the population standard deviation is 34. A. Use a t-distribution B. Use a normal distribution
Which method? In a random sample of 70 bolts, the mean length was 1.25 inches and the sample standard deviation was 0.01 inch. A. Use a t-distribution B. Use a normal distribution
Point Estimate for p A survey of 150 adults showed that 43 voted in the last election. Find a point estimate (rounded to 3 decimal places) for p, the population proportion of people who voted. .287
Confidence Interval When 500 college students were surveyed, 200 said they cheated on an exam in high school. Construct a 95% confidence interval for the proportion of college students who cheated in high school. • (.557, .643) • (.357, .443) • (.378, .422)
Minimum Sample Size You are running a political campaign and wish to estimate, with 95% confidence, the proportion of registered voters who will vote for your candidate. Your estimate must be accurate within 3% of the true population. Find the minimum sample size needed if no preliminary estimate is available. (Remember to round up.) 1068
Minimum Sample Size You are running a political campaign and wish to estimate, with 95% confidence, the proportion of registered voters who will vote for your candidate. Your estimate must be accurate within 3% of the true population. Find the minimum sample size needed if p = 0.31. (Remember to round up.) 914
Confidence Intervals Construct a 90% confidence interval for the population mean. Assume the population has a normal distribution. A sample of 15 randomly selected students has a g.p.a. of 2.86 with a standard deviation of 0.78. A.) (2.41, 3.42) B.) (2.28, 3.66) C.) (2.51, 3.21) D.) (2.37, 3.56)
Confidence Intervals A coffee machine is supposed to dispense 12 ounces of coffee in each cup. An inspector selects a random sample of 40 cups of coffee and finds they have an average of 12.2 ounces with a standard deviation of 0.3 ounce. Using a 95% confidence, is the machine is dispensing acceptable amounts of coffee? No