Download
1 / 34
340 likes | 502 Vues
Seasonal Volume Forecasts Using Ensemble Streamflow Prediction for the 2006 Water Year. Steve King, Hydrologist Northwest River Forecast Center. Topics for Presentation. Northwest River Forecast Center: Overview and Definitions NWRFC Long Range Forecasting Models and Products

E N D
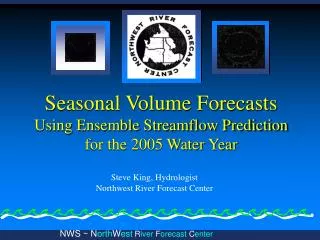
Seasonal Volume Forecasts Using Ensemble Streamflow Prediction for the 2006 Water Year Steve King, Hydrologist Northwest River Forecast Center
Topics for Presentation • Northwest River Forecast Center: • Overview and Definitions • NWRFC Long Range Forecasting Models and Products • Statistical Water Supply Forecasts • Ensemble Streamflow Prediction (ESP) • Recap of WY 2005 Forecasts • 2006 Volumetric Streamflow Outlook
Northwest River Forecast Center Total Area: 315,795 Columbia and Snake River Basins Coastal Drainages of Oregon and Washington 6 States & CANADA Support for 9 NWS Field Offices (WFOs) Grand Coulee Dam Lower Granite Dam The Dalles Dam The Willamette at Salem
The NWRFC issues several flavors of longterm volumetric forecasts: Observed Flow Natural Flow Adjusted Flow
Inflow Storage #1 Diversion Storage #2 Observed Outflow Natural Outflow Observed vs Natural Flow Conservation of Mass: Inflow – Outflow = Change in Storage Natural Flow = Outflow + Diversion + Return Flow + Consumptive Use + Evaporation Loss + Channel Loss + Change in Storage
Adjusted Flow (may or may not be Natural) Inflow Storage #1 Diversion Storage #2 Observed Outflow Adjusted Flow = Outflow + Major Diversions + Major Change in Upstream Storage **Forecast Outflow requires forecasted project releases and target pool elevations
Corps of Engineers Bureau of Reclamation Others Adjusted Runoff Volume COLUMBIA RIVER AT GRAND COULEE = + Change in Lake Storage at: MICA DAM REVELSTOKE DAM NAKUSP ARROW LAKE LIBBY DAM DUNCAN DAM KOOTENAY LAKE HUNGRY HORSE DAM KERR DAM PEND OREILLE LAKE PRIEST NOXON RAPIDS DAM COEUR D' ALENE LAKE LONGLAKE GRAND COULEE DAM + Runoff Volume FEEDER CANAL AT BANKS COLUMBIA RIVER AT GRAND COULEE Grand Coulee Dam The Dalles Dam The Willamette at Salem
Corps of Engineers Bureau of Reclamation Others Grand Coulee Dam The Dalles Dam The Willamette at Salem Adjusted Runoff Volume COLUMBIA RIVER AT THE DALLES = + Change in Lake Storage at: MICA DAM REVELSTOKE DAM NAKUSP ARROW LAKE LIBBY DAM DUNCAN DAM KOOTENAY LAKE HUNGRY HORSE DAM KERR DAM PEND OREILLE LAKE PRIEST NOXON RAPIDS DAM COEUR D' ALENE LAKE LONGLAKE GRAND COULEE DAM LAKE CHELAN BROWNLEE DAM DWORSHAK DAM JOHN DAY RESERVOIR + Runoff Volume FEEDER CANAL AT BANKS COLUMBIA AT THE DALLES
NWRFC Forecasting Models • Statistical Water Supply • Seasonal Forecasts • Regression techniques • Adjusted Flow Volumes • NWS River Forecast System • Short, Medium, and Longterm capabilities • Generates output in deterministic AND probabilistic (ESP) formats • 2 Outputs for ESP • Adjusted Flow: similar to regression-based Water Supply (147 points) • Natural Streamflow (302 NWSRFS forecast points)
Statistical Water Suppy Combined Index: Observed Precip Observed Snow Observed Runoff Future Precip
Water Supply Forecasts Products: • Issued 3 times per month • Mid December – July Content: • Agency Coordinated Forecasts (147 Points) • Contingency Plots (future precip 50%, 75%, 125% of normal) Issued according to schedule posted on NWRFC website: www.nwrfc.noaa.gov
Statistical Water Supply Product Jan-Jul Volume 30 yr Normal Jan-Jul Volume 2005 Forecast 2005 Jan-Jul Cumulative ObsVolume 81.39 MAF – 76%
Rain Plus Snow Melt NWS River Forecast System Model Components (simplified) Snow Model Soil Moisture/Runoff Consumptive Use River Routing Reservoir Regulation Flow and Stage Forecasts
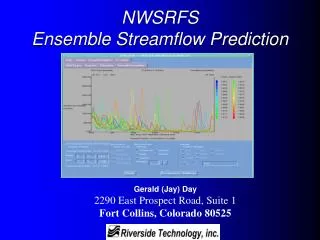
Ensemble Streamflow Prediction(ESP) Forecast technique combining NWS hydrology model with historical precip and temperature record Each trace represents combination of current model states with a historical climatic condition Ensemble output “traces” depict range of possible flow conditions Traces can be analyzed using statistics to produce probabilistic forecasts
Median Forecast (most expected) Example showing 42 traces outcomes for The Columbia River at The Dalles, OR Traces represent ensemble of possible river flow behavior (Jan-Jul) Exceedance probability plot of flow volumes = area under each trace (Jan-Jul period) 50% Value (most expected) is comparable to WS forecasts
ESP Volume Forecasts ESP Volume Forecasts Statistical Water Supply
ESP Spring Outlook • Ensemble Streamflow Prediction (ESP) • Adjusted Volume Forecasts Issued for Statistical Water Supply Points (147) • Natural Volume Forecast for all NWSRFS Points (302) • Updated weekly • Driven by Antecedent Snow/Soil Moisture, 10 day Precip and Temperature Forecast • Soon to incorporate climate forecasts
ESP Sensitivity Study:Summer/Fall Soil Moisture NWSRFS has a memory for soil moisture that extends many weeks into the future This memory can be exploited for the purpose of producing spring outlooks
2005 Volumetric ForecastsESPCompared to Water Supply (Jan-Jul ‘05)
ESP Natural Stream Flow Apr-Sep 2006 Issued Oct 25, 2005
ESP Natural Streamflow Forecasts Water Supply Inputs
2006 Outlook ESP Adjusted Forecasts (comparable to WS) 100% of Normal (63 MAF) 93% of Normal (30 MAF) 91% of Normal (107 MAF)
Taking Advantage of Climate Forecasts: • ESP Pre Adjustment Technique: • CPC Outlooks are used to shift distribution of model inputs (temp and precip)
Taking Advantage of Climate Forecasts: 97 96 83 89 39 01 77 • ESP Post Adjustment Technique: • Yearly Weights applied to ESP traces • Used to include/exclude historical years