Red vs. Blue
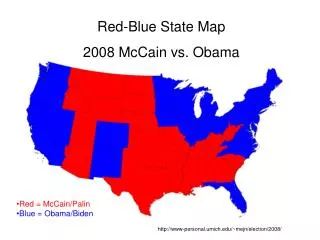
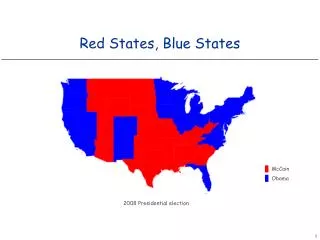
Red vs. Blue. Is partisanship tearing us apart?. The map that started it all, 2000 . I. The “Red vs. Blue” Narrative: Some Propositions. The Pundits’ Story (clarified):

Red vs. Blue
E N D
Presentation Transcript
Red vs. Blue Is partisanship tearing us apart?
I. The “Red vs. Blue” Narrative: Some Propositions • The Pundits’ Story (clarified): • Identity: Party identity has become an important part of self-identity, so that Red (pro-Republican) and Blue (pro-Democrat) are as salient as religion, race, place, etc. • 50/50 Nation: The Red/Blue divide splits America down the middle • Polarization: The Red/Blue divide has been growing over time • Geographic Divide: Red America is a very different place than Blue America
B. The Polarized Public? Abramowitz’s Argument • [Polarization is increasing among ordinary people] (included in # 3) • Race, class, ideology, cultural views, and geography are reinforcing rather than cross-cutting cleavages • The Tea Party movement is an example of a radicalized mass movement
II. The identity thesis • Have Americans become more attached to their parties?
A. Party Images From Mark Brewer, Party Images in the American Electorate, 2009. • Party image = “Mental picture” that individuals have about a party • Can be treated as “likes” and “dislikes”
b. What do Americans see in their major parties? • See Handout
B. Partisan Loyalty: Increasing or Decreasing? • Increasing references in media • But is it real or a myth?
1. Party Identification – Long-Term Increase in Independents 2000 2004 2008 2012
2. Party Leaners – Few “Pure” Independents but many “Independent” leaners
C. Party Salience – How important are partisan ties? • Civic engagement – how important is politics? a. Attention to political news:
c. Salience of politics • Question: “Suppose that you alone could determine whether a Democrat or a Republican represents your Congressional district by paying a specific dollar amount? How much would you be willing to pay to ensure that a Congressman from your preferred party will win the office?” • Answer (yougov.com): 55% of respondents said “ZERO”
III. 50/50 Nation? Closeness and Depth • Is the Country Closely Divided? • Multiple Scholars: Yes. Elections 2000 and 2004 were close, and…
2. House Vote: Much closer than most of 1950-1990 2010 2006 2010
B. Polarization: Are Americans Deeply Divided? • Issues (Fiorina): No. See Figures 3.2 and 3.4. Centrism on ideology and major issues. But see also Abramowitz. Further examples…
2. Changes in Party Identification Show Moderation Not Polarization 2000 2004 2008 2012
3. Ideology: a. Public much less divided than politicians (2006)
State-level Ideology: no evidence of sharp divide. Centrists dominate most states Fiorina: Gap is an artifact of “winner takes all” – voters similar in both kinds of states
c. Even partisans are cross-pressured • Most partisans disagree with own party on at least one salient issue (common in 2000-2004: abortion, gay marriage) • Creates opportunities for persuasion during campaigns • Many apparently divisive issues are really “wedge” issues meant to peel off cross-pressured partisans, not (just) to excite the base
4. Comparative Evidence (2008): Larger gaps between partisans than other countries
C. Conclusions • Americans are closely divided competitive elections at national level • Americans are centrists on many “wedge” issues creates cross-pressured voters • Evidence on public polarization is mixed, depending on issue and measure of opinion • Need more precise measures of polarization – would allow comparison over time
A. Is Elite Partisanship Increasing? • Introducing NOMINATE scores: An unbiased method for measuring political differences • Assumption 1: Political decisions are connected – position on one issue helps to predict position on other issues • Assumption 2: Whatever connects issue positions is a continuum, so we can rank people on this underlying dimension
2. Finding the underlying dimension: An example Three legislators, four bills (A through D). What rank-ordering best explains these voting patterns?
a. Rank-Order the legislators Options: JKP JPK KJP KPJ PJK PKJ
a. Rank-Order the legislators Options: JKP JPK KJP KPJ PJK PKJ
a. Rank-Order the legislators Options: JKP JPK KJP
b. Rank-Order the Bills Options: ABCD ABDC ACBD ACDB ADBC ADCB BACD BADC BCAD BDAC CABD CBAD
i. Check each combination • First combination to check: JKP and ABCD J K P A B C D Implications: J more likely to vote for A than K 0 J more likely to vote for A than P 1 K more likely to vote for C than J 0 K more likely to vote for D than J -1 K more likely to vote for A than P 1 K more likely to vote for B than P -1 P more likely to vote for D than K 1 P more likely to vote for D than J 0
ii. Now re-check with different policy positions • First combination to check: JKP and ABCD J K P ABC D A BC D A BCD A B CD Etc…
iii. Repeat for every possible combination • NOMINATE scores generated using a supercomputer • Note that none of the possible orderings is likely to be correct all of the time, given dozens or hundreds of legislators and bills (all roll-call votes in which 2.5% or more disagree)
d. Which combination performs best? Possible Implication: K loves B and hates C, while P loves C and hates B. Everyone and everything else is moderate.
e. Now suppose there are multiple dimensions…. • Examples: • Social freedom vs Economic freedom • International cooperation and international militancy • All of the above (4 dimensions!) • Authors find one or two dimensions are all that is needed: • Currently just one (liberal vs. conservative). • Very high (.81) correlation with hand-coded scores of liberalism vs. conservatism – the computer found something that matches our understanding!