Download
1 / 1
10 likes | 34 Vues
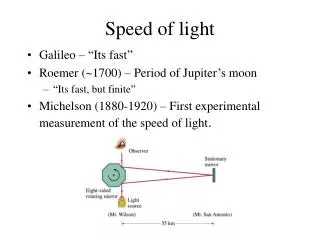
This study details a physics experiment using an adjustable cavity helium-neon laser to measure the speed of light with precision. Students gain practical experience in optics, error analysis, and regression techniques. The experiment explores phenomena such as polarization and laser modes. Results demonstrate students' exposure to experimental techniques and instruments like the laser, Fabry-Perot interferometer, and spectrum analyzer. The experiment provides accurate measurements of the speed of light under different conditions.

E N D
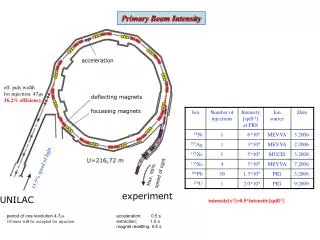
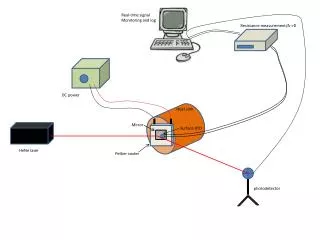
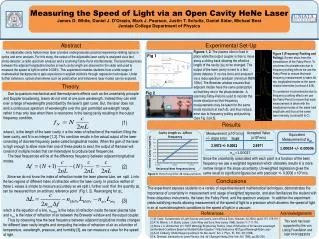
A B C Accepted Value (x108m/s) Measurement +/- slope error 2.9972+/- 0.0002 2.9971 Measuring the Speed of Light via an Open Cavity HeNe Laser James D. White, Daniel J. D’Orazio, Mark J. Pearson, Justin T. Schultz, Daniel Sidor, Michael BestJuniata College Department of Physics Experimental Set-Up Abstract Figures 1, 2: The plasma tube is fixed in place while the output coupler is free to move along a sliding track allowing the effective length of the cavity (ΔL) to be changed. The output of the laser cavity is sent to a fast photo detector (1 ns rise time) and analyzed via a radio spectrum analyzer (minimum RBW 10Hz). The Brewster window ensures that adjacent modes have the same polarization so that they mix in the photo-detector. A scanning Fabry-Perot is used to monitor the mode structure so that frequency measurements may be taken for the same mode structure at each ΔL and thus reduce error due to frequency pulling and pushing (See Fig 3) [4,5]. An adjustable cavity helium-neon laser provides undergraduates practical experience relating topics in optics and error analysis. For this study, the output of the adjustable laser cavity is analyzed via a fast photo-detector, a radio spectrum analyzer and a scanning Fabry-Perot interferometer. The beat-frequencies between the adjacent longitudinal modes at each cavity length are observed in the radio and used to measure the speed of light to within 0.008%. This experiment enables students from a wide range of mathematical backgrounds to gain experience in applied statistics through regression techniques. Under further extension, optical phenomena such as polarization and transverse laser modes can be explored. Figure 3 (Frequency Pushing and Pulling): Screen shots from the transmission of the Fabry-Perot. To counteract inconsistencies due to frequency pulling effects we use the Fabry-Perot to ensure that each frequency measurement is taken for two longitudinal modes at the same relative intensities (contrast A & B). To counteract inconsistencies due to frequency pushing effects we use the Fabry-Perot to ensure that each measurement is taken with the longitudinal modes at the same total amplitude and thus at the same laser intensity (contrast B & C). Fig 1 Theory Fig 2 Due to quantum mechanical and thermodynamic effects such as the uncertainty principle and Doppler broadening, lasers do not emit at one pure wavelength. Instead they can emit over a range of wavelengths prescribed by the laser's gain curve. But, the laser does not emit a continuous spectrum of wavelengths over the gain permitted wavelength range, rather it may only lase when there is resonance in the lasing cavity resulting in the output frequency condition, PD OC Plasma Tube (1) Results where L is the length of the laser cavity, n is the index of refraction of the medium filling the laser cavity, and N is an integer [1,2]. This condition results in the actual output of the laser consisting of discrete frequency peaks called longitudinal modes. When the gain of the laser is high enough to allow more than one of these peaks to exist, the output of the laser will consist of multiple modes that can heterodyne to produce beat frequencies. The beat frequencies will be at the difference frequency between adjacent longitudinal modes, (x108m/s) In air Equivalent Measurement of nair 1.00024 +/- 0.00006 nair=1.00027 Since the uncertainty associated with each point is a function of the beat frequency we use a weighted regression which ultimately results in a more narrow range in the slope uncertainty. Un-weighted regression gives the same result to significant figures but with precision +/- 0.0006 x 10⁸m/s. (2) Figure 3: Plot of eq.(3) for 28 measurements Since we do not know the index of refraction inside the laser plasma tube, we split L into the two regions of different index of refraction within the laser cavity. In practice neither of these L values is simple to measure accurately so we split L further such that the quantity ΔL can be measured from an arbitrary reference point (Fig 1, 2). Rearranging for ΔL, Conclusions This experiment exposes students to a variety of experimental and mathematical techniques, demonstrates the importance of uncertainty in measurement and usage of weighted regression, and also familiarizes the student with three ubiquitous instruments, the laser, the Fabry-Perot, and the spectrum analyzer. In addition the experiment yields satisfying results allowing measurement of the speed of light to a precision which discerns the speed of light in air at room/atmospheric conditions to the speed of light in a vacuum. (3) which is the equation of a line, nHeNe is the index of refraction inside the laser plasma tube and nair is the index of refraction of air between the Brewster window and the output coupler. Thus by observing how the beat frequency between adjacent longitudinal modes changes for different laser cavity lengths and computing the index of refraction of air as a function of temperature, wavelength, pressure, and humidity [3], we can measure a value for the speed of light. Acknowledgements References [1] M. Csele, Fundamentals of Light Sources and Lasers, (John Wiley & Sons, Hoboken, NJ 2004), pp.83-115, 159-191. [2] P. W. Milonni, J.H. Eberly, Lasers (John Wiley and Sons, New Jersey 1988), Section 11.7-11.11A. [3] Stone J. A. Zimmerman J.H. “NIST Metrology Engineering Toolbox, Index of Refraction of Air Vacuum wavelength and Ambient Conditions Based on Modified Edlen Equation” <http://emtoolbox.NIST.gov/Wavelength/Edlen.asp> [4] A. M. Lindberg, “Mode frequency pulling in He-Ne Lasers”, Am. J. Phys. 67, 350 -353 (1999). [5] K. Shimoda, Introduction to Laser Physics, 2nd. ed.”(Springer-Verlag, New York, NY, 1986), pp.202-204. This work has been supported by the von Liebig Foundation and NSF PHY-0653518