Download
1 / 16
160 likes | 354 Vues
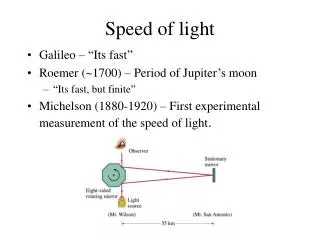
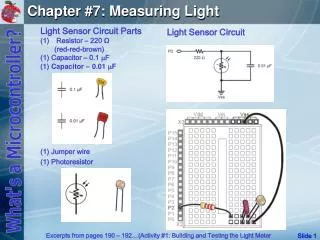
Measuring the Speed of Light. Jack Young Rich Breazeale Ryan Phelan. Table of Contents. Reasons to Perform This Experiment Properties of the He-Ne Laser Experimental Setup and Procedure Data Data Analysis Results Conclusion. Reasons to Perform This Experiment.

E N D
Measuring the Speed of Light Jack Young Rich Breazeale Ryan Phelan
Table of Contents • Reasons to Perform This Experiment • Properties of the He-Ne Laser • Experimental Setup and Procedure • Data • Data Analysis • Results • Conclusion
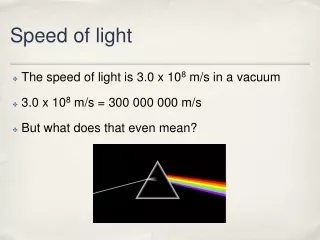
Reasons to Perform This Experiment • To find out if the measured value agrees with theory • The speed of light c is an important constant found in many physics formulas • It is the connection between matter and energy E=mc2
Properties of the He-Ne Laser • Population inversion • Stimulated Emission • Monochromatic light • Coherent light • Collimated light
Population Inversion • Electrons accelerated in an electric field collide with the helium atoms in the gas. This excites helium from the ground state to the 2s and 3s long-lived, metastable excited states. • Collision of the excited helium atoms with the ground-state neon atoms results in transfer of energy to the neon atoms, exciting them into the 2s and 3s states. This is due to a coincidence of energy levels between the helium and neon atoms. • The Neon now has a population inversion, more electrons in its higher energy states than in the ground state. • The population inversion causes the electrons in the 3s state to spontaneously drop to a lower energy state, releasing photons which are coherent and monochromatic (633nm).
Stimulated Emission • When a Neon atom absorbs a 632.8 nm photon and its population is inverted (many electrons in the 3p state), the incident photon is reemitted and in many cases one or more electrons will drop from the 3p to the 2p state, resulting in the emission of another 632.8 nm photon. • The photons produced in this “stimulated emission” will all be coherent (in phase). • Each photon produced can be absorbed by another Neon atom to stimulate the emission of more coherent photons. • This “pumping” of the laser medium leads to a chain reaction of stimulated emissions
Coherence Non-coherent light • Coherence arises from the stimulated emission process. Since a common stimulus triggers the emission events which provide the amplified light, the emitted photons are "in step" and have a definite phase relation to each other. Coherent light
Collimation • The mirrors at each end of the laser tube are parallel so the laser light reflected from them is nearly perfectly parallel to the tube. • This results in a collimated beam.
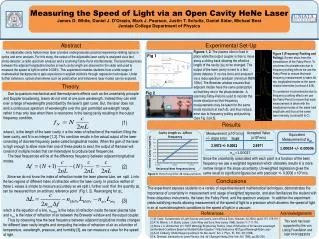
Experimental Procedure • We measured the phase of each modulated laser beam and found the temporal difference between them. • This difference indicated the different times the two beams took to reach the detector box. • Based on the path length difference and the phase difference, we were able to determine the speed of the laser beam.
Data Analysis • Using Scientist, we calculated the slope of the graph of phase difference vs. path length difference. • Scientist calculated the slope at 3.168 (ns/m) and the standard deviation at 0.043 (ns/m). • This standard deviation is 1.3688% the slope value. • We inverted this slope to get our measured speed and determined the standard deviation. • We also determined the delay in the equipment’s circuitry by determining the y-intercept on the time vs. distance graph.
Results • The calculations give us: 3.16 (+/-0.04) x 108 m/s • Scientist found the “y-intercept” to be at T = –18.37 ns • This is the delay due to circuitry
Conclusion • Our measurement of the speed of light is about four standard deviations away from the accepted value • Something is wrong with our data or, more likely, our error analysis • We probably could have achieved better results if our distance measurements were more accurate • It sucks to do experiments in the hallway