Download
1 / 82
820 likes | 1.04k Vues
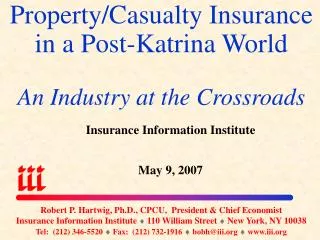
Catastrophic Risk: Impacts & Implications for the P/C Insurance Industry:. Houston Marine Insurance Seminar Houston, TX September 18, 2006. Robert P. Hartwig, Ph.D., CPCU, Executive Vice President & Chief Economist Insurance Information Institute 110 William Street New York, NY 10038

E N D
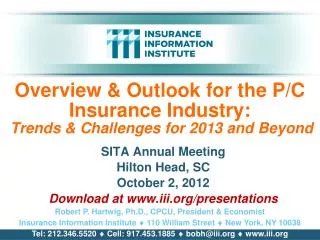
Catastrophic Risk: Impacts & Implications for the P/C Insurance Industry: Houston Marine Insurance Seminar Houston, TX September 18, 2006 Robert P. Hartwig, Ph.D., CPCU, Executive Vice President & Chief Economist Insurance Information Institute 110 William Street New York, NY 10038 Tel: (212) 346-5520 Fax: (212) 732-1916 bobh@iii.org www.iii.org
Presentation Outline • P/C Profit Overview • Underwriting Trends • Primary & Reinsurance • Competitive Pressures Mounting: Pricing Trends • Financial Strength & Ratings • Investments • Capital & Capacity • Catastrophe Loss Management • Terrorism: Are TRIA’s Days Numbered? • Q & A
P/C Net Income After Taxes1991-2006E ($ Millions)* • 2001 ROE = -1.2% • 2002 ROE = 2.2% • 2003 ROE = 8.9% • 2004 ROE = 9.4% • 2005 ROAS1= 10.5% • 2006 ROAS2 = 15.4% 2006 Net Income may shatter previous records *ROE figures are GAAP; 1Return on avg. surplus. 2005 ROAS = 9.8% after adj. for one-time special dividend paid by the investment subsidiary of one company. 2Based on Q1 results; For 12 months ending 3/31/06, ROAS=10.1%. Sources: A.M. Best, ISO, Insurance Information Inst.
ROE vs. Equity Cost of Capital:US P/C Insurance:1991-2006E The p/c insurance industry achieved its cost of capital in 2005 +5.9 pts -9.0 pts +0.2 pts +1.0 pts -13.2 pts US P/C insurers missed their cost of capital by an average 6.7 points from 1991 to 2002, but on target 2003-05 *Based on 2006:Q1E ROAS of 15.4% Source: The Geneva Association, Ins. Information Inst.
ROE: P/C vs. All Industries 1987–2006:Q1 Insurers will outperform only if CAT losses are “normal” 2004/5 ROEs excl. hurricanes Sept. 11 Hugo Katrina, Rita, Wilma Lowest CAT losses in 15 years Andrew Northridge 4 Hurricanes *2006 P/C insurer ROE based on annualized Q1 results. Source: Insurance Information Institute; Fortune
WALL STREET:MAINTAINING THE CONFIDENCE OF WALL STREET IS CRITICAL FOR MANY INSURERS
Change in YTD Stock Performance by Sector Pre- & Post-Katrina/Rita/Wilma P/C & reinsurer stocks hurt but now fully recovered. Brokers rose on expectation of tighter conditions and demand for broker services; closure of Spitzer issues. Katrina: Aug. 29 Rita comes ashore Sept. 24 Wilma landfall Oct. 24 Source: SNL Securities; Insurance Information Institute
P/C Insurance Stocks Off to a Slow Start in 2006 Total YTD Returns Through September 8, 2006 P/C insurer stocks now up in 2006. Investors less worried about potential hurricane losses, but price weakness looms. Broker stocks hurt by weak earnings Source: SNL Securities, Standard & Poor’s, Insurance Information Institute
UNDERWRITINGSurprisingly Strong in 2005, Stage is Set for a Good 2006!
P/C Industry Combined Ratio 2005 figure reflects heavy use of reinsurance which lowered net losses, but still a substantial deterioration from first half 2005 2006 is Off to a Strong Start Expectation is for an underwriting profit Sources: A.M. Best; ISO, III. *III forecasts/estimates for 2006 first half and full year.
Underwriting Gain (Loss)1975-2006F Insurers sustained a $5.9 billion underwriting loss in 2005. 2006 could become only the second underwriting profit in 28 years, assuming “normal” CAT losses. 06Q1 U/W profit was $8.4B. $ Billions Source: A.M. Best, Insurance Information Institute
A 100 Combined Ratio Isn’t What it Used to Be: 95 is Where It’s At Combined ratios today must be below 95 to generate Fortune 500 ROEs * 2005/6 figures are return on average statutory surplus. Source: Insurance Information Institute from A.M. Best and ISO data.
Commercial Lines Combined Ratio, 1993-2006E* Outside CAT-affected lines, commercial insurance is doing fairly well. Caution is required in underwriting long-tail commercial lines. 2006 results dependent on a return to “normal” catastrophe loss levels Source: A.M. Best; Insurance Information Institute *Fitch estimate for 2005. Actual 1H05 combined ratio all lines was 92.7.
REINSURANCE MARKETSHigher Reinsurance Costs Squeezing Insurers, Pushing Property CAT Prices Upward
Global Number of Catastrophic Events, 1970–2005 The number of natural and man-made catastrophes has been increasing on a global scale for 20 years Record 248 man-made CATs & record 149 natural CATs in 2005 Man-made disasters: without road disasters. Source: Swiss Re, sigma No. 1/2005 and 2/2006.
Combined Ratio: Reinsurance vs. P/C Industry Sept. 11 2004/5 Hurricanes HurricaneAndrew Source: A.M. Best, ISO, Reinsurance Association of America, Insurance Information Institute
Share of Losses Paid by Reinsurers, by Disaster* Reinsurance is playing an increasingly important role in the financing of mega-CATs; Reins. Costs are skyrocketing *Excludes losses paid by the Florida Hurricane Catastrophe Fund, a FL-only windstorm reinsurer, which was established in 1994 after Hurricane Andrew. FHCF payments to insurers are estimated at $3.85 billion for 2004 and $4.5 billion for 2005. Sources: Wharton Risk Center, Disaster Insurance Project; Insurance Information Institute.
Property Catastrophe Price Index*1994 - 2006 US CAT prices are continue to rise faster than anywhere else in the world *Insurance Information Institute figure of 13.8% for 2005 based estimated 2005 DPE of $417.7B and insured CAT losses of $57.7B. Includes primary and reinsurance coverage. Sources: ISO, A.M. Best, Swiss Re Economic Research & Consulting; Insurance Information Institute.
Reinsurance Prices Surged in 2006 Following Record CATs in 2005 In hurricane-prone areas, property CAT reinsurance prices are up 100-300%+ US cat reinsurance price index: 1994 = 100 Sources: Swiss Re, Cat Market Research; Insurance Information Institute estimate for 2006.
Changes in the 2006 Reinsurance Markets • Property CAT reins. rates up 20% - 30% nationally • Property CAT coverage in hurricane exposed areas up 100%-300% • Marine/Energy Reinsurance Up 300%+ • Most challenging markets for reinsurers today • Aggregate reinsurer exposure is down 20-30% • Cedants retaining more risk, often by 50-100% or more (higher attachment pts.) • Increased demand for Excess of Loss cover • XoL is potentially more volatile for reinsurers • Some supply issues as a few small players enter run-off • Retrocessional market is much tighter Sources: Morgan Stanley, Lehman Brothers, III
A Look Ahead to Reinsurance Markets for 2007 • Despite lack of major hurricane in 2006, reinsurance pricing strong in US for 2007 • New capital entry not sufficient to fully meet demand • Reinsurance prices flat at best outside peak CAT zones • Retrocessional market still tight • Softening in European p/c reinsurance markets • Softening in US casualty reinsurance markets • More pronounced if property cat reinsurers shift emphasis • Capital market role expanding • Hedge funds, private equity • Securitization: Insurance Linked Securities • Some concern over staying power, (lack of) regulation • Complement or competitor to traditional reinsurance? Sources: Insurance Information Institute.
UNDERWRITING AFFECTS FINANCIAL STRENGTHIs There Causefor Concern?
Reasons for US P/C Insurer Impairments, 1969-2005 2003-2005 1969-2005 Deficient reserves, CAT losses are more important factors in recent years *Includes overstatement of assets. Source: A.M. Best: P/C Impairments Hit Near-Term Lows Despite Surging Hurricane Activity, Special Report,Nov. 2005;
Historical Ratings Distribution,US P/C Insurers, 2000 vs. 2005 2000 2005 A++/A+ shrinkage Ratings agencies increasing emphasis on multiple eventsrequire more capital Source: A.M. Best: Rating Downgrades Slowed but Outpaced Upgrades for Fourth Consecutive Year, Special Report,November 8, 2004 for 2000; 2006 Review & Preview for 2005 distribution. *Ratings ‘B’ and lower.
2006 SRQ CAT Model Reqs.* All Property Exposure Auto Physical Damage Reinsurance Assumed Pools & Assessments All Flood Exposure WC Losses from Quake Fire Following Storm Surge Demand Surge Secondary Uncertainty ALSO “A.M. Best will perform additional “stress-tested” risk-adjusted capital analysis for a second event in order to determine the potential financial condition of an entity post a severe event.” IMPLICATION: Some insurers may be required to carry more capital to maintain the same rating. Ratings Agencies Tightening Requirements for CATs Best currently estimates PML for 100-yr. wind & 250-yr. quake to determine capital adequacy *SRQ = Supplemental Rating Questionnaire Source: A.M. Best Review & Preview, January 2006.
Strength of Recent Hard Markets by NWP Growth* 1975-78 1984-87 2001-04 2006-2010 (post-Katrina) period could resemble 1993-97 (post-Andrew) 2005: biggest real drop in premium since early 1980s *2006-10 figures are III forecasts/estimates. 2005 growth of 0.4% equates to 1.8% after adjustment for a special one-time transaction between one company and its foreign parent. 2006 figure of 1.9% is based on 2006:Q1 data. Note: Shaded areas denote hard market periods. Source: A.M. Best, Insurance Information Institute
Average Commercial Rate Change,All Lines, (1Q:2004 – 2Q:2006) Magnitude of rate decreases has diminished greatly since mid-2005 Source: Council of Insurance Agents & Brokers; Insurance Information Institute
Average Commercial Rate Change by Account Size Commercial accounts trended downward from early 2004 to mid-2005 but now that trend is shrinking post-Katrina Source: Council of Insurance Agents & Brokers
Average Commercial Rate Change by Line Commercial property accounts are renewing sharply upward (+9.3%) in 2Q06. All other lines are renewing down. Source: Council of Insurance Agents & Brokers
Percent of Commercial Accounts Renewing w/Positive Rate Changes, 2ndQtr. 2006 Largest increases for Commercial Property & Business Interruption are in the Southeast, smallest in Midwest Source: Council of Insurance Agents and Brokers
Commercial Accounts Rate Changes,2ndQtr. 2005 vs. 2nd Qtr. 2006 Only commercial property is renewing up in 2006 Source: Council of Insurance Agents and Brokers
UNDERWRITING CAPACITYCan the Industry Efficiently Employ Its Increasing Capital?
U.S. Policyholder Surplus: 1975-2006* Capacity TODAY is $440.1B, 10.1% above year-end 2005, 54% above its 2002 trough and 30% above its 1999 peak. $ Billions Foreign reinsurance and residual market mechanisms absorbed 50%+ of 2005 CAT losses of $62.1B “Surplus” is a measure of underwriting capacity. It is analogous to “Owners Equity” or “Net Worth” in non-insurance organizations Source: A.M. Best, ISO, Insurance Information Institute *As of 3/31/06.
Announced Insurer Capital Raising*($ Millions, as of December 1, 2005) As of Dec. 1, 19 insurers announced plans to raise $10.35 billion in new capital. Twelve start-ups plan to raise as much as $8.75 billion more for a total of $19.1 billion. Actual total higher as Lloyd’s syndicates have added capacity for 2006. *Existing (re) insurers. Announced amounts may differ from sums actually raised. Sources: Morgan Stanley, Lehman Brothers, Company Reports; Insurance Information Institute.
Announced Capital Raising by Insurance Start-Ups($ Millions, as of April 15, 2006) As of April 15, 14 start-ups plan to raise as much as $10 billion. *Chubb, Trident are funding Harbor Point. Announced amounts may differ from sums actually raised. **Stated amount is $750 million to $1 billion. ***XL Capital/Hedge Fund venture. Arrow Capital formed by Goldman Sachs. Sources: Investment Bank Reports; Insurance Information Institute.
Property/Casualty Insurance Industry Investment Gain* Investment gains are up but are only now comparable to gains seen in the late 1990s *Investment gains consist primarily of interest, stock dividends and realized capital gains and losses. 2006 estimate based on actual annualized 2006:Q1 results. **2005 figure includes special one-time dividend of $3.2B. Source: ISO; Insurance Information Institute.
CATASTROPHE LOSS MANAGEMENTInsurers Have Done a Better Jobat Managing CAT Risk
Most of US Population & Property Has Major CAT Exposure Is Anyplace Safe?
2005 Was a Busy, Destructive, Deadly & Expensive Hurricane Season All 21 names were used for the first time ever, so Greek letters were used for the final storms 2005 set a new record for the number of hurricanes & tropical storms at 28, breaking the old record set in 1933. Source: WeatherUnderground.com, January 18, 2006.
2005 Was a Busy, Destructive, Deadly & Expensive Hurricane Season What a difference a year makes! Just 8 named storms through Sept. 18, 2006 vs. 17 as of same date in 2005! Source: WeatherUnderground.com, September 17, 2006.
2006 Hurricane Season: Forecasts Repeatedly Scaled Back 2006 hurricane seasons has turned out to be far less severe than anticipated *Average over the period 1950-2000. Source: Insurance Information Institute compilation of forecasts by Dr. William Gray, Colorado State University.
U.S. InsuredCatastrophe Losses ($ Billions)* $100 Billion CAT year is coming soon $ Billions 2005 was by far the worst year ever for insured catastrophe losses in the US, but the worst has yet to come. *Excludes $4B-$6b offshore energy losses from Hurricanes Katrina & Rita. ** As of June 30, 2006. Note: 2001 figure includes $20.3B for 9/11 losses reported through 12/31/01. Includes only business and personal property claims, business interruption and auto claims. Non-prop/BI losses = $12.2B. Source: Property Claims Service/ISO; Insurance Information Institute
Number of Major (Category 3, 4, 5) Hurricanes Striking the US by Decade 1930s – mid-1960s: Period of Intense Tropical Cyclone Activity Mid-1990s – 2030s? New Period of Intense Tropical Cyclone Activity 10 Tropical cyclone activity in the mid-1990s entered the active phase of the “multi-decadal signal” that could last into the 2030s Already as many major storms in 2000-2005 as in all of the 1990s *Figure for 2000s is extrapolated based on data for 2000-2005 (6 major storms: Charley, Ivan, Jeanne (2004) & Katrina, Rita, Wilma (2005)). Source: Tillinghast from National Hurricane Center: http://www.nhc.noaa.gov/pastint.shtm.
Top 10 Most Costly Hurricanes in US History, (Insured Losses, $2005) Seven of the 10 most expensive hurricanes in US history occurred in the 14 months from Aug. 2004 – Oct. 2005: Katrina, Rita, Wilma, Charley, Ivan, Frances & Jeanne Sources: ISO/PCS; Insurance Information Institute.
Insured Loss & Claim Count for Major Storms of 2005* Hurricanes Katrina, Rita, Wilma & Dennis produced a record 3.3 million claims *Property and business interruption losses only. Excludes offshore energy & marine losses. Source: ISO/PCS as of June 8, 2006; Insurance Information Institute.
Hurricane Katrina Insured Loss Distribution by State ($ Millions)* Louisiana accounted for 62% of the insured losses paid and 56% of the claims filed Total Insured Losses = $40.579 Billion *As of June 8, 2006 Source: PCS division of ISO.
Hurricane Katrina Loss Distribution by Line ($ Billions)* Total insured losses are estimated at $40.579 billion from 1.7438 million claims. Excludes $2-$3B in offshore energy losses *As of June 8, 2006 Source: PCS division of ISO.