Download
1 / 13
130 likes | 253 Vues
This summary outlines key environmental factors essential for predicting severe thunderstorms. It covers relevant aspects of surface maps, including warm air temperatures above 50°F, high dew points, and triggers such as cold fronts and outflow boundaries. The evaluation of upper-level maps helps identify dry air intrusions and unstable pockets. Additionally, it discusses the importance of indices like CAPE and others for assessing severe weather likelihood. The document emphasizes the significance of local NWS warnings and procedures for distinguishing between straight-line winds, hail, and tornado events.

E N D
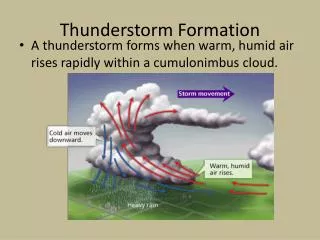
The Pre-storm Environment • On the Surface map, look for: • Warm air, T > 50 F • High dew points > 50 F • “Triggers” • a. Cold front • b. Dryline • c. pressure trough • d. Outflow boundaries
850 mb map: • Temperature Ridge • Humidity Ridge • Low level jet
700 mb map: • Dry air (intrusion) for convective instability
Cool air “pockets” Difluent areas 500 mb:
300 mb, 250 mb, 200 mb: • Jets Ageostrophic flow sets up cap Cap is broken when jet moves
Soundings • T1 Humid at low levels Dry above 700 mb Capping Inversion • Indices (CAPE, LI, TT, SWEAT, etc …
Composite Charts are very helpful to assess the areas of likely severe weather: • By only plotting symbols of features favorable to severe trws, “clutter = severe
NWS Warning Procedure • Convective outlook early in day (from SPC) Not for public warning purposes Often seen on the Weather Channel.
Watches (from SPC) Tornado Severe Thunderstorm
Verification is done by local offices and reported to SPC and NCDC
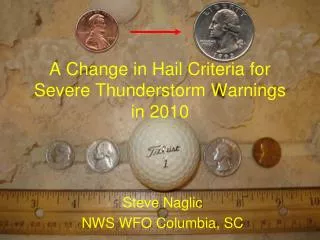
For straight-line wind only, look for a. uni-directional shear (speed shear) b. dry air to create downward momentum For large hail, look for a. large lapse rates in the hail growth zone b. Wet-bulb zero between 2200 and 2800 m (about 770 hPa to 720 hPa) For tornadoes, look for a. both speed and directional shear b. large lapse rates (CAPE) c. more ingredients to increase severity