Download
1 / 55
550 likes | 649 Vues
Explore the dynamics of gas hydrate systems and the potential energy resources they hold. Understand the processes influencing methane flux and hydrate saturation using modeling techniques. Investigate pore water chemistry and reaction zones to quantify hydrate distribution.

E N D
Modeling Shallow Pore Water Chemistry above Marine Gas Hydrate SystemsSayantan Chatterjee, Gerald Dickens, Gaurav Bhatnagar, Walter Chapman, Brandon Dugan, Glen Snyder, George Hirasaki Rice University, Houston, Texas, USA April 23, 2012 Rice University Consortium on Processes in Porous Media DE-FC26-06NT 42960
Gas hydrates Cage structure “Ice that burns” Core sample Source: USGS Source: USGS Torres et al., Earth Planet. Sci. Lett., (2004)
A fundamental understanding of the dynamics of gas hydrate systems Motivation Potential energy resource Recoverable and Non-recoverable fossil fuels (coal, oil, natural gas), 5,000 Subsea geohazard Global climate change McIver, AAPG (1982) Westbrook et al., Geo. Res. Lett., (2009)
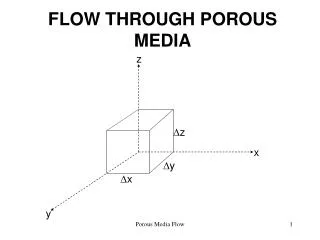
Schematic of hydrate formation and burial Phase relationships Components Transient state Steady state Organic carbon Sediment flux Hydrotherm Seafloor ao TOC SO42- SO42- reduction zone T0 Depth CH4 Hydrate Solubility CH4 3-phase equilibrium Hydrate layer extending downwards Dissolved gas GHSZ Hydrate dissociation due to burial below the GHSZ Geotherm Base of GHSZ Sedimentation fluid flux Transient state Free gas recycling Steady state Free gas External fluid flux 0 10 20 30 0 100 200 300 Temperature (oC) Concentration (mM) Subsidence Subsidence Geologic time (Myr) Bhatnagar et al., Am. J. Sci., (2007); Chatterjee et al., (2012) to be submitted
Methods to quantify gas hydrate amount and distribution 994 995 997 Paull et al., ODP Init. Repts., 164, (1996) Boswell et al., Mar. Pet. Geo., (2011) Free gas Dickens., Org. Geochem., (2001)
Gas hydrate systems and the SMT SMT: Sulfate Methane Transition Bhatnagar et al., Geo. Res. Lett., (2008)
SMT depth inversely proportional to upward methane flux SMT Depth below seafloor Chemosynthetic community Fault line SMT SMT Gas hydrate free sediment Gas hydrate bearing sediment Paull et al., Geo-Mar. Lett., (2005) Borowski et al., Geology, (1996)
Key model features • CH4 solubility and phase equilibrium curves • Sedimentation and compaction • Mass balance equations: • Sediment • Water • Organic carbon • Methane (CH4) • Sulfate (SO42-) • Bicarbonate (HCO3-) • Calcium (Ca2+) • Carbon isotopesof CH4 and HCO3- • CH4sources: • In situ methanogenesis (biogenic) • Deep external sources (thermogenic) • Advection, diffusion and reaction PDEs solved using finite-difference method (Explicit and implicit schemes)
Geologic sites known/inferred for gas hydrates Chatterjee et al., J. Geophys. Res., (2011)
Modeling pore water chemistry at 3 sites Chatterjee et al., J. Geophys. Res., (2011)
Flux balance across the SMT using steady-state simulations At the SMT: Diffusive flux Advective flux = 0 Chatterjee et al., J. Geophys. Res., (2011); Chatterjee et al., (2012) to be submitted
A 1:1 flux balance across SMT implies dominant AOM at the SMT flux • Anaerobic Oxidation of Methane (AOM) flux Chatterjee et al., J. Geophys. Res., (2011); Chatterjee et al., (2012) to be submitted
SMT depth: A useful proxy Depth below seafloor Hydrate saturation Top of gas hydrate Pe1<Sh> SMT depth SMT depth Chemosynthetic community Fault line SMT Gas hydrate free sediment Gas hydrate bearing sediment Paull et al., Geo-Mar. Lett., (2005) Normalized Scaled SMT depth “Rule of ten” Top of hydrate / SMT Bhatnagar et al., Geochem. Geophys. Geosyst., (2011) Scaled SMT depth
Modeling to quantify hydrate amount and distribution Local fluid flux Hydrotherm Depth T3P Geotherm Pe1<Sh> Base of GHSZ Depth “Rule of ten” Top of hydrate / SMT Scaled SMT depth
Conclusions • A 1:1 flux balance across the SMT implies dominant AOM at the SMT • SMT depth is a direct proxy to relate upward methane flux and hydrate saturation • An empirical “rule of ten” established to relate SMT depth and top of hydrate • Developed a model to evaluate hydrate amount and distribution
Pore water chemistry and reaction zones Sulfate reduction zone Methanogenesis zone Snyder et al., J. Geochem. Explor., (2007)
Pore water chemistry data: Sites 1244 and KC151 Chatterjee et al., J. Geophys. Res., (2011)
Pore water chemistry data: Site 1230 Chatterjee et al., (2012) to be submitted
Concentration crossplot of DIC and SO42- Chatterjee et al., J. Geophys. Res., (2011)
Steady state profiles: Site 1244 Chatterjee et al., J. Geophys. Res., (2011)
Steady state profiles: Site KC151 Chatterjee et al., J. Geophys. Res., (2011)
Physical property data: Site 1230 Pressure (MPa) Chatterjee et al., (2012) to be submitted
Evidence of a 4.3 Myr hiatus implies Site 1230 is in transience Hiatus
Pre-hiatus steady state profiles: Site 1230 Seafloor 2.4 Myr ago Chatterjee et al., (2012) to be submitted
Transient state profiles: Site 1230 Chatterjee et al., (2012) to be submitted
pH and activity correction Chatterjee et al., (2012) to be submitted
Geotherm correction Chatterjee et al., (2012) to be submitted
Effect of DaAOM Chatterjee et al., J. Geophys. Res., (2011)
Effect of DaPOC Chatterjee et al., J. Geophys. Res., (2011)
2:1 concentration crossplot Chatterjee et al., J. Geophys. Res., (2011)
Concentration crossplot: Site 1244 Da= 1; Cb,ext = 50 Da = 0.22; Cb,ext = 27 Chatterjee et al., J. Geophys. Res., (2011)
Concentration crossplot: Site KC151 Chatterjee et al., J. Geophys. Res., (2011)
Concentration crossplot: Site 1230 Chatterjee et al., (2012) to be submitted
Concentration crossplots CANNOT determine stoichiometry Site 685/1230 Chatterjee et al., J. Geophys. Res., (2011); Chatterjee et al., (2012) to be submitted
Flux crossplot: Site 1244 Chatterjee et al., J. Geophys. Res., (2011)
Flux crossplot: Site 1230 Chatterjee et al., (2012) to be submitted
Two potential causes for SMT • Anaerobic Oxidation of Methane (AOM) • (1:1) • Organoclastic Sulfate Reduction (OSR) • (2:1) = Dissolved Inorganic Carbon (DIC) ~ Alkalinity
Arguments for OSR: Stoichiometry and d13C of DIC • OSR (2:1); δ13CDIC ≈ -25‰ AOM (1:1); δ13CDIC ≈ -60‰ Site 1244 OSR Depth (mbsf) ∆ (Alk+Ca+Mg) Depth (mbsf) AOM SO42-, Alkalinity (mM) ∆SO4 d13CDIC (‰) ∆ = change from seawater Kastner et al., Fire in the ice, (2008)
Counterarguments for AOM and methanogenesis • OSR (2:1); δ13CDIC ≈ -25‰ AOM (1:1); δ13CDIC ≈ -60‰ • Methanogenesis; δ13CDIC ≈ 10‰ Site 1244 -60‰ (AOM) Depth (mbsf) ∆ (Alk+Ca+Mg) Depth (mbsf) +10‰ (methanogenesis) SO42-, Alkalinity (mM) ∆SO4 d13CDIC (‰) Deep DIC flux is enriched in 13C Flux units mol/m2kyr Dickens and Snyder., Fire in the ice, (2009)
13C enriched DIC flux from depth impacts alkalinity and d13C of DIC at SMT • AOM (δ13CDIC ≈ -60‰) • Methanogenesis (δ13CDIC ≈ 10‰) • OSR (δ13CDIC ≈ -25‰) Chatterjee et al., J. Geophys. Res., (2011)
OSR dominated systems CH4and SO42- DIC (or HCO3-)Ca2+δ13C in DIC
Distinct zones of local fluid flux Seafloor Low local fluid flux Low local fluid flux High local fluid flux BHSZ
Local SMT depends on local fluid flux Low flux in sediment High flux in fracture PeLocal = - 29 Normalized depth Normalized depth PeLocal = - 0.85 SMT depth Normalized concentration Normalized concentration BHSZ BHSZ Low flux in sediment High flux in fracture <Sh>Local = 6% <Sh>Local = 22% Normalized depth Normalized depth Top of gas hydrate Hydrate and free gas Hydrate and free gas
Generalized model to quantify amount and distribution of gas hydrates Biogenic sources only Biogenic sources and external flux Pe1<Sh> • Net fluid flux (Pe1) • and org C input at seafloor • Hydrate • saturation • Hydrate • saturation • Net fluid flux (Pe1 + Pe2) Bhatnagar et al., Am. J. Sci., (2007)
Kinetic and equilibrium reaction model Methanogenesis reaction: AOM reaction at the SMT: POC driven sulfate consumption above the SMT: Calcite precipitation reaction:
δ13C definition The isotopic carbon composition (δ13C ) in any sample is defined The isotope ratios usually reported in per mille, relative to an standard Pee-Dee-Belemnite (PDB) marine carbonate
Reactions with corresponding δ13C values Methanogenesis reaction: AOM reaction of biogenic methane at the SMT: Organoclastic sulfate consumption: Calcite precipitation reaction:
1-D organic carbon mass balance Dimensionless mass balance
1-D methane mass balance Dimensionless mass balance